
使用 Google Apps Script 實現每日數據報表 RPA 自動化
使用 Google Apps Script 進行 Google Workspace 相關服務之 Robotic Process Automation 自動化

Photo by Possessed Photography
Robotic Process Automation
RPA (Robotic Process Automation) 中文翻譯為「流程自動化機器人」回顧人類發展歷史,從徒手採集到石器時代再到農耕文明,從上個世紀的工業革命開始到近 20 年的資訊崛起,人類的工作效率與產能有了指數級的飛躍成長;這一路上無處不在 RPA 應用的身影,農耕時期的水車(自動化脫穀工作)、工業革命的紡織機(自動化紡織工作)、工廠機械手臂(自動化組裝工作),最後是本篇要介紹的,自動化資訊相關工作,例如:自動查詢報表、自動通知…等等工作。
說來慚愧,我也是最近才知道這個名詞,打從從第一份工作開始 (7 年前),就一直有在做 RPA 的事,諸如撰寫爬蟲統計數據、自動化 CI/CD 流程、自動化查詢數據、自動化穩定性數據告警、自動化每日例行操作…等等;不過以往我都以「自動化」三個字作為代稱,是時候給他一個正名了 — RPA (Robotic Process Automation)。
之前所做的 RPA 更多只關注在「動手寫程式實現自動化工作解決單一問題」上 ,少了前期的完整評估與分析、No/Low Code 工具使用、法規、運行監控、實際數據統計、持續改進、企業文化推廣…等等,這都是完整的 RPA 需要做的事;不過如同前面所說,我也是最近才知道這個專業領域,就容我還是先以實作方面水一篇文章吧!
提供 RPA 服務的平台有很多,例如 Automation Anywhere,UiPath, Microsoft Power Automate, Blue Prism 或是 Zapier, IFTTT, Automate.io … 要依照實際想解決的問題與平台挑選適合的服務。
推薦一套免費開源基於瀏覽器的 RPA Tool: Automa 。
另外廣義來說,將人與人或人與事的主動依賴轉化成人對平台、事對平台的依賴也是一種 RPA。
例如:統一使用 Asana/Jira…等專案管理工具統一管理工作事項。
基於主動轉被動的理念,原本需要人工上去檢查有無新通知的服務,我們也可以實現一個 RPA,當有新變動時自動通知我們。
例如:之前實現過的 Gmail to Slack 將特定通知信件轉發到工作群組。
Robotic Process Automation 的效益評估
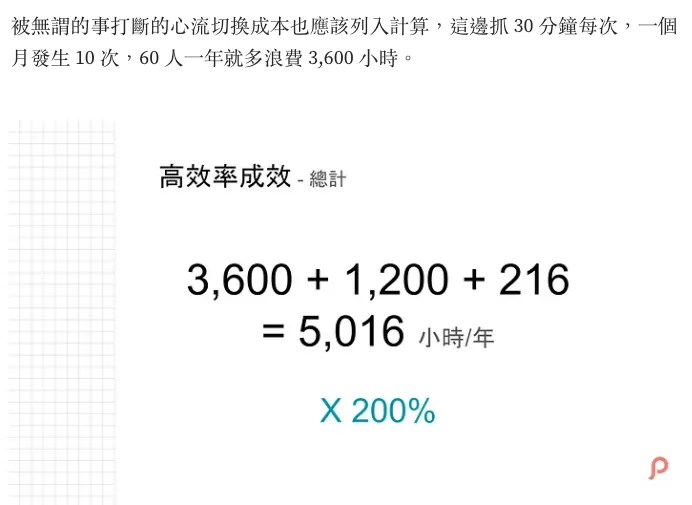
之前在「 2021 Pinkoi Tech Career Talk — 高效率工程團隊大解密 」分享過積少成多及心流中斷的成本問題;假設一件例行重複性的工作,每次需要花費 15 分鐘解決,每週會發生 10 次,一年下來就浪費將近 130 小時;如果再算上「心流切換」成本,最終可能浪費近 200 小時一年。
2021 Pinkoi Tech Career Talk — 高效率工程團隊大解密
心流切換的意思是,當我們專注在重要的事情上做得正 High! 時,需要暫停去處理其他事情,處理完畢再回來重新進入狀態所耗費的時間。
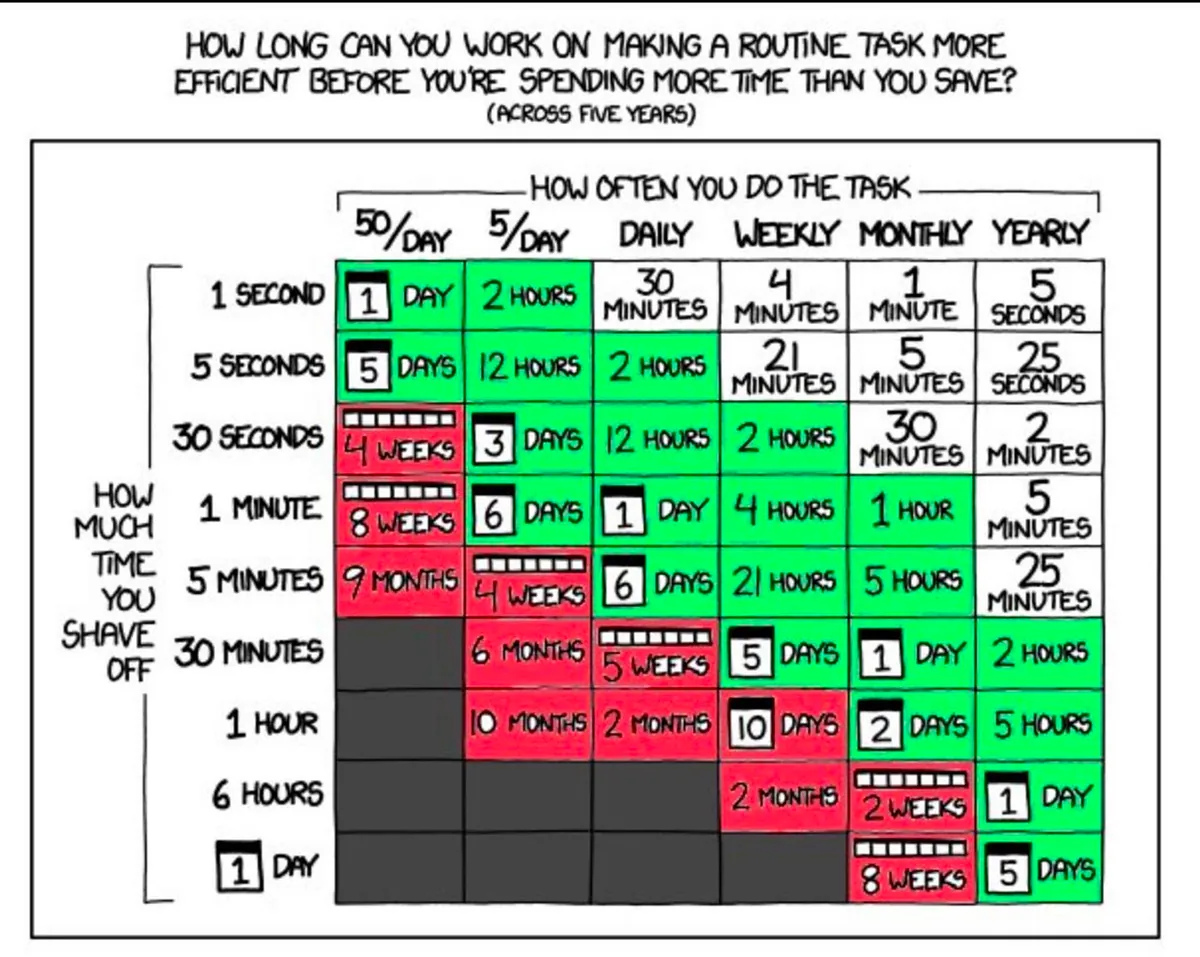
開發 RPA 的效益評估可參考下圖,只要開發所需時間跟遇到的頻率大於所浪費的時間,就值得投入資源實現:
https://twitter.com/swyx/status/1196401158744502272
- X 軸:任務發生頻率 ex: 50/Day (50次一天)
- Y 軸:任務每次需花費多少人力時間才能完成
- 耗費時間 Range 抓 5 年來算,表格中間表示 5 年下來浪費的時間人力成本
- 白色為可能投入做自動化的時間成本大於能得到的效益,不值得改善
- 綠色表示值得自動化的項目
- 紅色為強烈建議轉為自動化
除了節省時間之外,自動的制式化流程也能減少人工出錯機率,提升穩定性。
Robotic Process Automation 跟 AI 的關係
隨著 AI 興起,RPA 也經常被提及;但我覺得 RPA 與 AI 並無直接關係, 沒有 AI 的年代早就有 RPA,企業導入 AI 的幫助可能還沒有完善 RPA 的效益來得高,RPA 更多的還是企業文化、工作習慣的問題 ;不過不可否認 AI 確實能幫助 RPA 邁向下一個層次,例如以往 RPA 只能做確切、例行的工作,有了 AI 就能做一些模糊的、較動態的、智能判斷的工作。
Robotic Process Automation at Google Workspace
Google Workspace (舊稱 G Suite),是我們日常辦公協作的好夥伴,信箱使用 Gmail 託管、文件放在 Google Doc、報表使用 Google Sheet、表單使用 Google Form…等等,這些服務之間的串接或是與內外部系統的溝通,都需要我們實現 RPA 來完成。
但 Google 並沒有提供直接的 RPA 服務,可以透過以下幾個服務達成:
- No Code: App Sheet (付費服務),讓非開發人員直接透過 GUI 搭建服務串接自動化。
- Low Code: Google Apps Script (免費服務),簡單撰寫程式就能快速直接的橋接 Google 服務、外部/內部系統。
- Function as a Service: Cloud Functions (付費服務,提供免費額度),撰寫完整程式碼、服務,透過 Google Cloud 部署直接執行。
No Code 平台 App Sheet 我沒接觸過, Cloud Functions 與 Google Apps Script 算蠻有經驗的,以下是一些個人之前的使用與選擇經驗分享:
Cloud Functions
- 需部署執行
- 支援使用多種程式語言撰寫:Node.js, Python, Java, Go, PHP, Ruby…
- 支援第三方套件依賴管理、安裝並使用
- 支援完整身份驗證機制
- 最多執行時間上限: 60 分鐘
- 用多少算多少:依照次數、執行時間、不同處理器、使用的記憶體收費
- 受限冷啟動問題(太久沒呼叫,再次呼叫,第一次會需要較長響應時間)
- 無法直接串接 Google 服務,需要走 Auth/API 驗證
- 免費方案如下 Cloud Functions 針對運算時間資源提供永久免費方案,當中包括 GB/秒和 GHz/秒的分配方式。除了 200 萬次叫用以外,這個免費方案也提供 400,000 GB/秒和 200,000 GHz/秒的運算時間,以及每月 5 GB 的網際網路資料傳輸量。免費方案的使用額度,是以上述級別 1 價格的同等美元金額計算。無論執行函式的區域採用的是級別 1 和/或級別 2 價格,系統都會分配同等美元金額給您。不過在扣除免費方案的額度時,系統將以函式執行區域的級別 (級別 1 或級別 2) 為準。 請注意,即便您採用的是免費方案,也必須擁有有效的帳單帳戶。
總結來說,Cloud Functions 可以提供較完整與複雜的 RPA 串接功能或是有較多的外部 API 串接需求時比較建議使用 Cloud Functions。
之前使用過 Cloud Functions 的案例有:
- [Slack ChatGPT 對話機器人]: Slack & ChatGPT Integration
- [自動簽到機器人]: 使用 Python+Google Cloud Platform+Line Bot 自動執行例行瑣事
都是與非 Google Workspace 服務整合且須橋接其他外部服務時我會使用。
Google Apps Script
- 方便簡單快速
- 完全免費
- 串接服務無需繁瑣複雜的 Auth 身份驗證 (Google Apps Script 是直接使用當前執行的帳號做為執行身份)
- 內建排程、行事曆觸發器功能
- 使用 Google 網路執行網路請求
- 只能使用 Google Apps Script (基於 JavaScript) 的語言開發
- 不支援套件管理工具、無版控功能
- 基於安全問題, 無法客製化 Request User-Agent 資訊
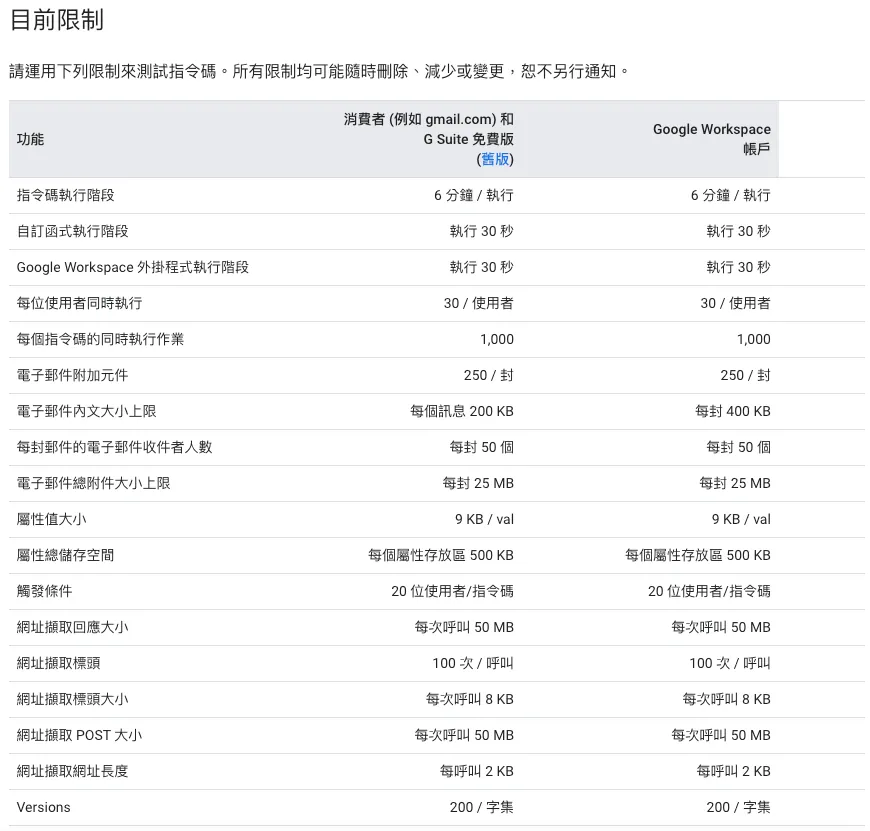
- 執行時間上限,腳本必須在 6 分鐘內完成工作,否則會被終止。
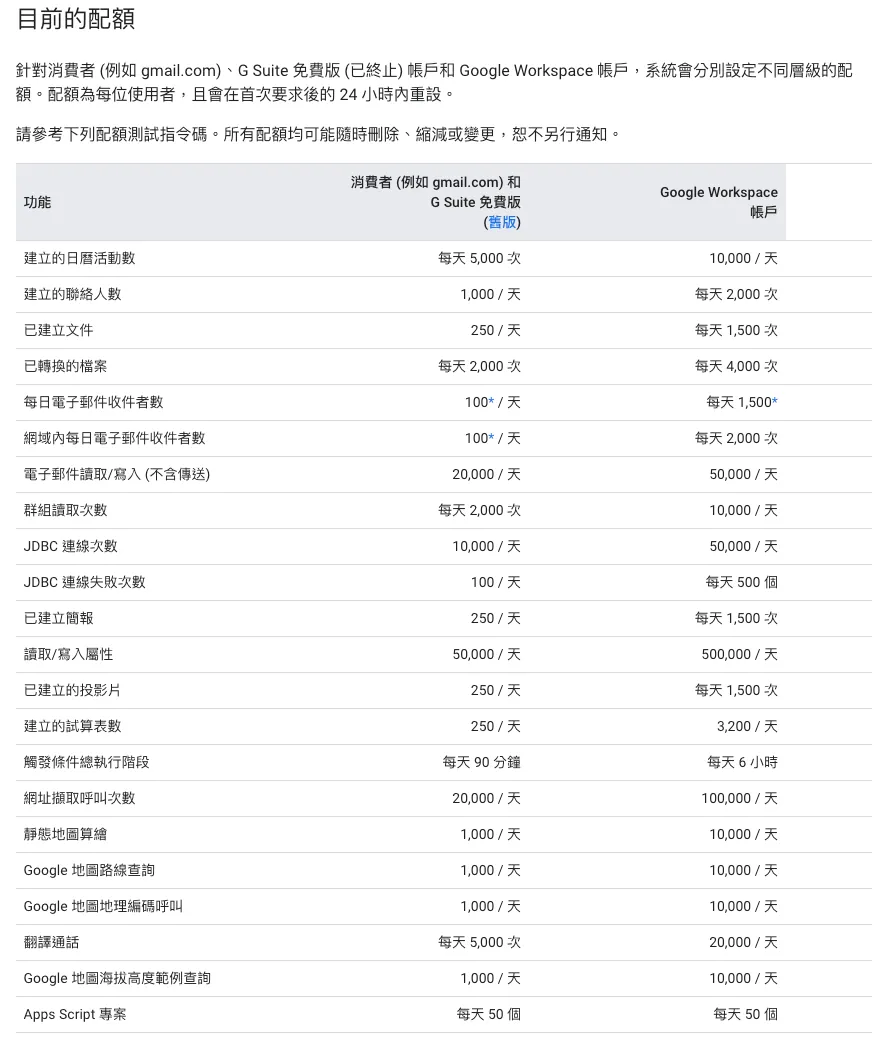
- 其他限制與配額請參考官方的 GAS 資訊 :
之前使用過 Google Apps Script 的案例有:
- [串接 Slack x Google Form x Google Sheet]: Slack 打造全自動 WFH 員工健康狀況回報系統
- [串接 Slack x Gmail]: 運用 Google Apps Script 轉發 Gmail 信件到 Slack
- [串接 Google Analytics x Slack]: Crashlytics + Google Analytics 自動查詢 App Crash-Free Users Rate
- [串接 Firebase Crashlytics x Big Query x Slack]: Crashlytics + Big Query 打造更即時便利的 Crash 追蹤工具
- [串接 Github x LineBot]: 使用 Google Apps Script 三步驟免費建立 Github Repo Star Notifier
受限於執行時間與 API Request 客製化限制,只有簡單快速的服務我會使用 Google Apps Script 達成;或是需要與 Google 服務串接的需求,我會優先選擇使用 Google Apps Script (因為用 Cloud Functions 要多實現完整的 Google 服務身份驗證流程)。
Robotic Process Automation with Google Apps Script — 工作日報表 (Google Sheet x Google Analytics)
終於來到本篇的主題,使用 Google Apps Script 實現 Google 服務 RPA 自動化。
背景
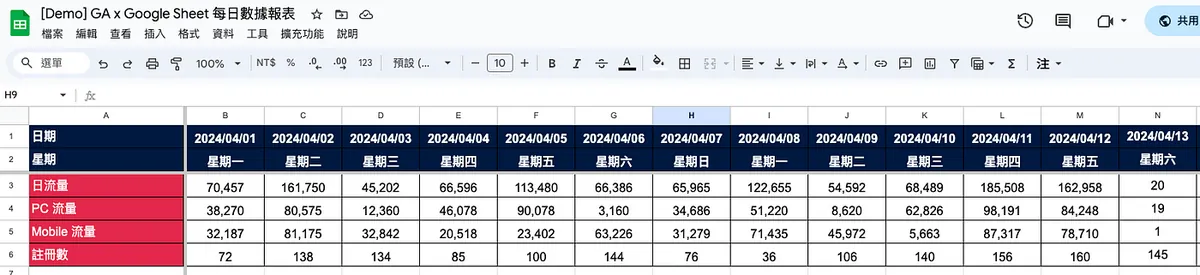
產品團隊需要每日查詢 Google Analytics 數據並填寫到 Google Sheet 數據報表上,共團隊分析趨勢使用;並將每日數據內容發佈到 Dashboard 螢幕上,讓所有成員掌握目前狀況。
同事每日一到公司就要花大約 30 分鐘左右完成此任務;如果有其他事要處理就需要等到這件例行工作完成才會開始或會延後發布每日數據訊息。
簡單估計一下 RPA 效益:
- 每年消耗支出: 1 人 x 30 mins x 365 天(假日數據也要補) = 182 hours
- 建立自動化成本: 以此案例來說,約需耗費 1 人 x 5天 = 40 hours
因此我們只需要投入一週開發時間,就能長遠解決負責查數據同事的工作消耗,他就可以把精力放在更重要的事情上。
目標
我們的目標是使用 Google Apps Script 建立一個 RPA 自動從 Google Analytics 與內部系統報表 API 撈取每日數據並填入 Google Sheet,與搭建一個 Web UI Dashboard。
最終效果
- Google Sheet: https://docs.google.com/spreadsheets/d/1-9lZCpsu3E7eDmO-lMkXJXQ6Y6KK4SiyU6uBODcDcFE/edit?usp=sharing
- Web GUI URL: https://script.google.com/macros/s/AKfycbz2Vk-ikU8DSXjpnLq9r6HNAn3zlNAosvDoItG0cxy0bmItRDSVyEzTdwsL2HyFUz99/exec
數據為假數據,純 Demo 使用;從 2024/04/13 開始會特別低或都保持在 0,因為我的 zhgchg.li GA 真的是「0」流量 Q_Q。
需完成的任務
- 建立 Google Apps Script、熟悉編輯器
- 取得/建立對應日期的 Sheet
- 串接 Google Analytics 撈取數據
- 填充資料
- 設定排程,每日自動執行
聲明
因文章說明需求,以下程式碼會盡可能少一點抽象,增加說明性,您可依照自己實際的需求進行改寫。
文末有附上完整公開的 Google Sheet & Google Apps Script,如果你懶得一步一步走,可以直接從文末附的範本去修改。
Step 1. 建立 Google Apps Script
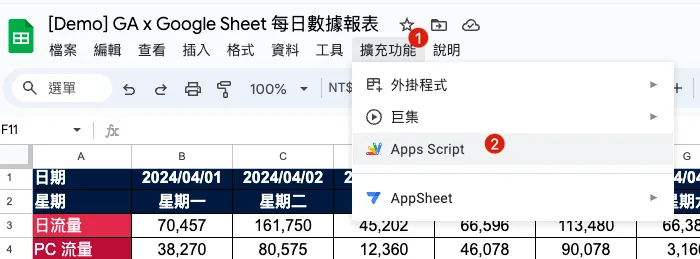
只需在我們要導入自動化的報表上選擇「擴充功能」->「Apps Script」就能自動建立與 Google Sheet 報表連結的 Google Apps Script。
另外也可以直接從 Google Apps Script 首頁建立 Google Apps Script ,不過這樣就不會與 Google Sheet 產生連結。
並非需要連結才能操作對應 Google Sheet ,兩種建立方式都可以,差別在於 Script 的所有權歸於誰,如果是連結報表的就是歸報表擁有者,如果是自己建立的就是歸建立著;擁有者會關係到假設該帳號因離職停用,腳本是否會失效被刪除。
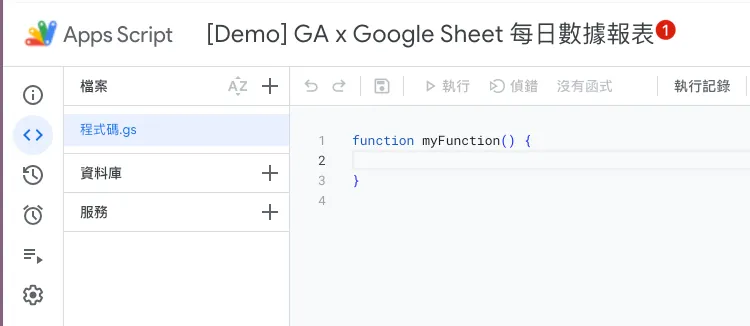
腳本建立後,我們可以先從上方 Rename 我們的腳本專案名稱。
Google Apps Script 基礎知識
再到下一步撰寫程式之前,先補充一些 Google Apps Script 的基礎知識。
關於編輯器
預設引入 Google 服務的 SDK (不需特別引入即可呼叫使用):
- CalendarApp 行事曆
- DocumentApp Google Drive
- FormApp Google Form
- SpreadsheetApp Google Sheet
- GmailApp Gmail
- 其他…
- 檔案: 可新增多個 .gs 檔案存放不同物件程式碼,方便整理;所有檔案都會在同個 Namespace、生命週期下執行,因此要注意物件名稱、變數名稱如果重複可能會互相覆蓋。 除 .gs 指令碼 檔案外,也能新增 .html HTML Template 檔案,用於渲染 Web UI。(後面會再介紹)
- 資料庫:
別人撰寫好的資料庫 (a.k.a Lib) 我們可以透過他的 Script ID 引入使用,當然我們撰寫好的程式也能部署成資料庫給別人用。
另外也有一些大神幫忙封裝的工具可以用,缺點是只能從 Google 搜尋 Script ID,官方並沒有正式的資料庫列表共查詢使用。
e.g. HTML Parser Tool Cheer.io Script ID:
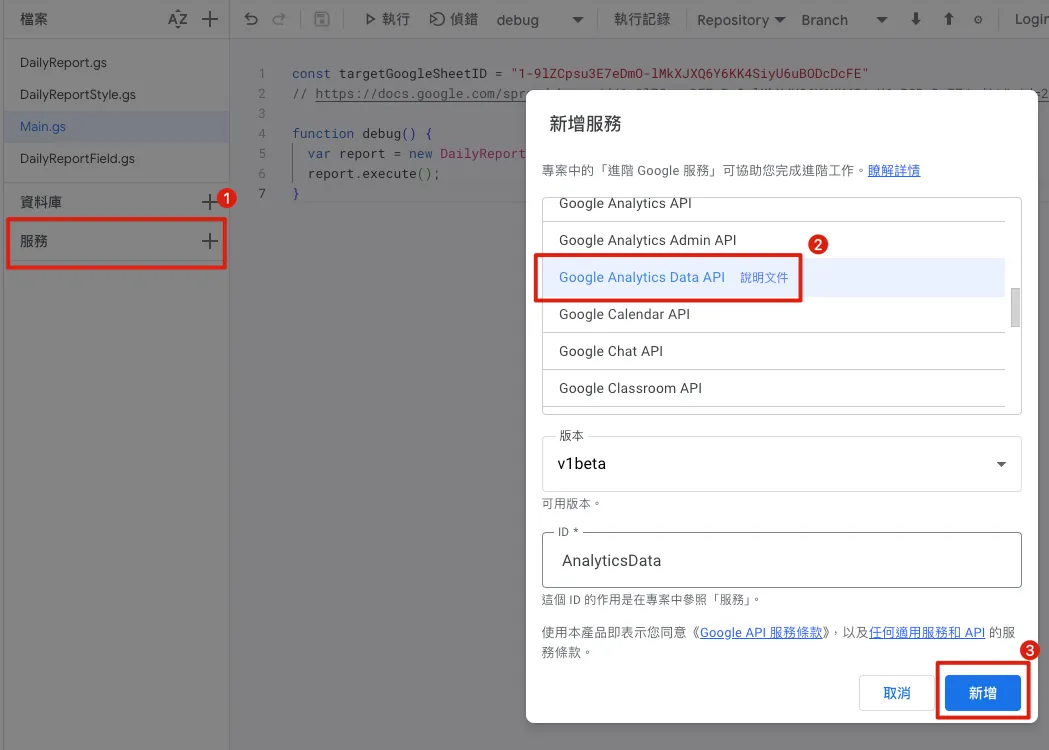
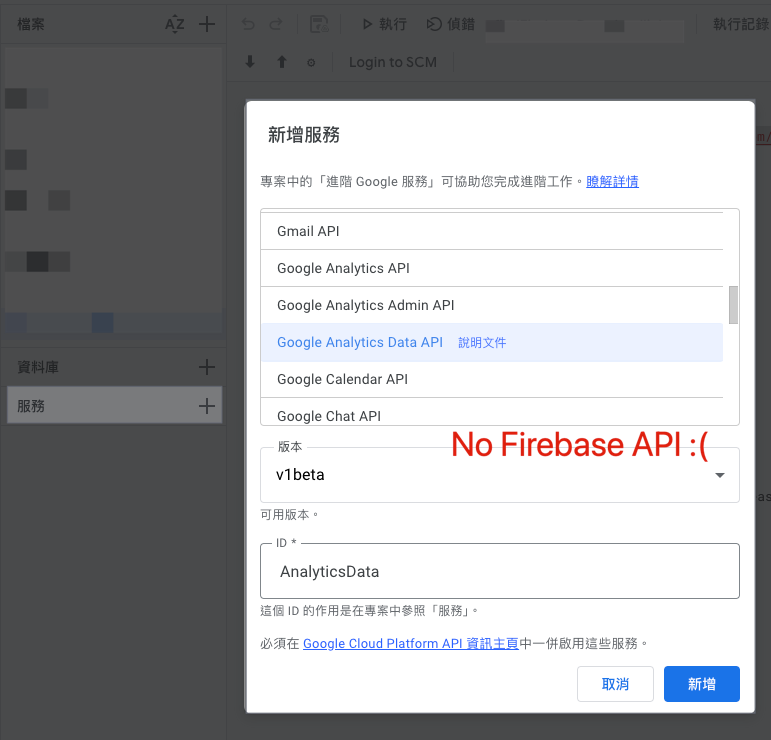
1ReeQ6WO8kKNxoaA_O0XEQ589cIrRvEBA9qcWpNqdOP17i47u6N9M5Xh0 - 服務: Google 服務的 SDK,預設沒有引入的服務可以再此追加引入使用。 e.g. Google Analytics Data
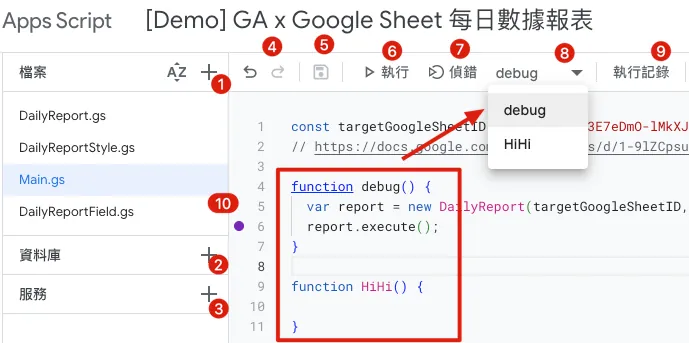
- 還原、下一步操作
- 儲存 或 Control + s
- 執行 或 Control + r 遇到錯誤直接在 Console 提示並終止腳本
- 偵錯 有下 Break point (10) 的地方執行到會暫停中斷並跳出右側 Debug View,可按繼續執行 遇到錯誤會暫停中斷並跳出右側 Debug View
- 偵錯、執行的目標方法(Function Name) 僅能選擇當前選擇的檔案所擁有的方法。
- 查看編輯器執行紀錄
另外還有一點就是排版,有的瀏覽器按下「Control + [」進行縮排時會觸發返回上一頁,這點要注意!
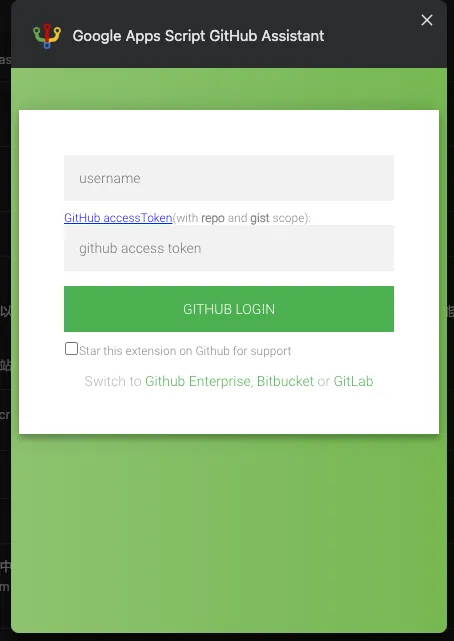
Google Apps Script GitHub Assistant Chrome Extension 版控外掛
- 建議安裝此 Extension 讓 Google Apps Script 與 git 串接,使其有版本控制功能,防止心血不小心改壞。
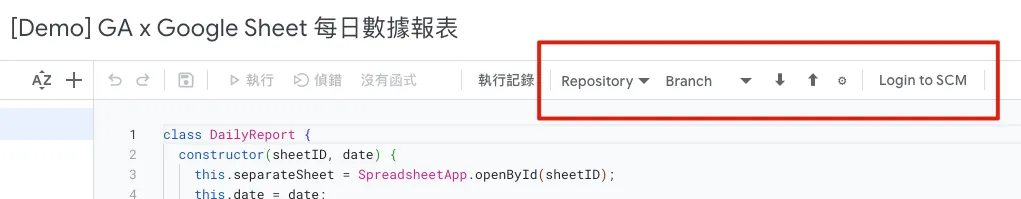
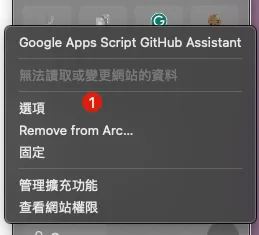
- 如果遇到 Push/Pull Error 或點了沒反應,請先按照上面步驟「選項」-> 連接 Github or 重新驗證一次 Google 授權,即可。
Logger Message
可使用以下 Script 搭配 Debug 就能在底下 Console Print 出 Debug Log。
Logger.log("Hi")
執行紀錄、錯誤資訊
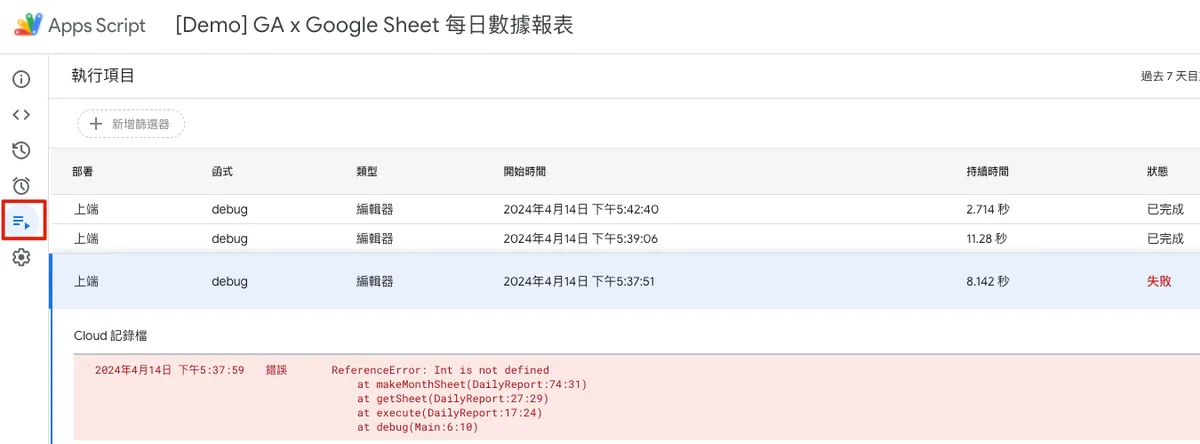
如果在編輯器上執行時的 Log 或報錯會直接顯示,如果要查訊執行紀錄或自動執行時發生的錯誤,可到「執行項目」頁籤查看。
自動觸發
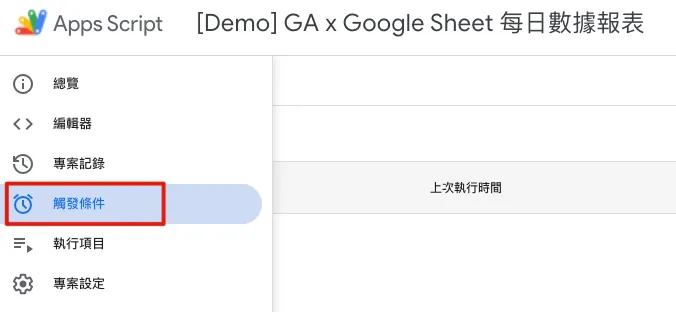
「觸發條件」頁籤可設定腳本中的方法該如何自動觸發執行,可以設定的自動觸發條件有:
- 當 Google Sheet:開啟時、編輯時、內容變更時、提交表單時 執行
- 排程週期觸發:每 X 分鐘、X 小時、X 日、X 週、X 月 執行一次
- 特定日期觸發:YYYY-MM-DD HH:MM 時執行
- 當 行事曆:更新時 執行
錯誤通知設定,可設定當腳本執行出錯時如何通知你。
授予執行權限身份
首次執行/部署或新增引入的服務、資源,都需要重新跑一次身份授權,授權完之後的執行都會用你授權的身份執行,所以也要確保你授權(通常是當前)的帳號有該資源、服務的權限。(e.g. 例如要有該 Google Sheet 權限)。
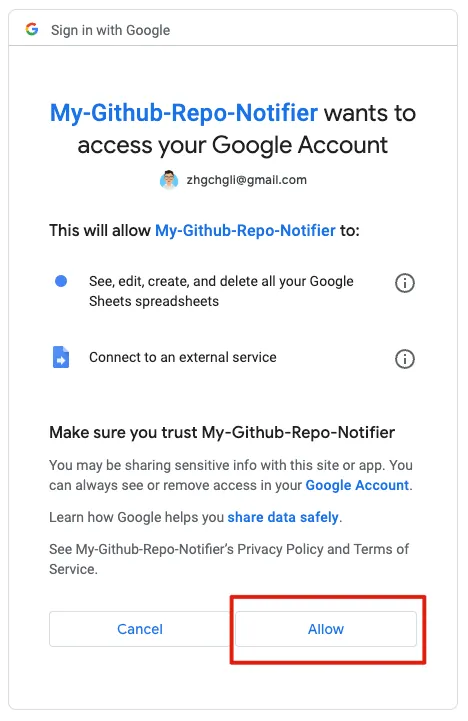
跳出帳號選擇 Pop-up 後選擇授權執行的帳號(通常是選當前 Google Apps Script 帳號):
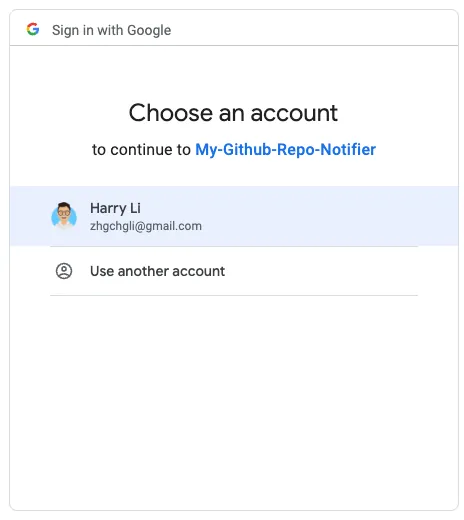
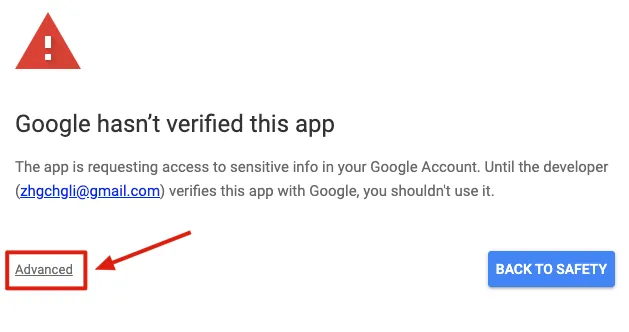
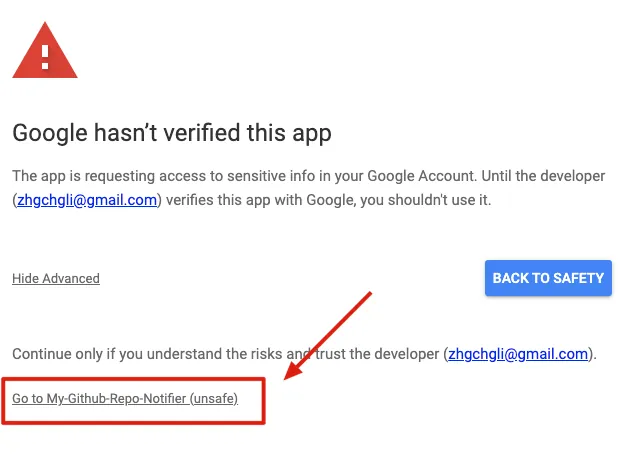
出現「Google hasn’t verified this app」因為我們要開發的 App 是給自己用的,不需經過 Google 驗證。
直接點擊「Advanced」->「Go to XXX (unsafe)」->「Allow」即可:
完成授權後就能成功執行腳本,如果沒有改動資源不需要再重新授權。
2. 取得/建立對應日期的 Sheet
了解完基礎知識後,我們就可以撰寫第一個功能的程式了。
我們建立以下多個檔案方便我們存放不同物件
DailyReportStyle.gs 欄位樣式物件:
class HeaderStyle {
  constructor() {
    this.color = "#ffffff";
    this.backgroundColor = "#e3284b";
    this.bold = false;
    this.size = 12;
    this.horizontalAlignment = "center";
    this.verticalAlignment = "middle";
  }
}

class ContentStyle {
  constructor() {
    this.color = "#000000";
    this.backgroundColor = "#ffffff";
    this.bold = false;
    this.size = 12;
    this.horizontalAlignment = "center";
    this.verticalAlignment = "middle";
  }
}

class HeaderDateStyle {
  constructor() {
    this.color = "#ffffff";
    this.backgroundColor = "#001a40";
    this.bold = true;
    this.size = 12;
    this.horizontalAlignment = "center";
    this.verticalAlignment = "middle";
  }
}
DailyReportField.gs 欄位資料物件:
class DailyReportField {
  constructor(name, headerStyle, contentStyle, format = null, value = null) {
    this.name = name;
    this.headerStyle = headerStyle;
    this.contentStyle = contentStyle;
    this.format = format;
    this.value = value;
  }
}
DailyReport.gs 報表主程式邏輯:
class DailyReport {
  constructor(sheetID, date) {
    this.separateSheet = SpreadsheetApp.openById(sheetID);
    this.date = date;

    this.sheetFields = [
      new DailyReportField("日期", new HeaderDateStyle(), new HeaderDateStyle()),
      new DailyReportField("星期", new HeaderDateStyle(), new HeaderDateStyle()),
      new DailyReportField("日流量", new HeaderStyle(), new ContentStyle(), "#,##0", '=INDIRECT(SUBSTITUTE(ADDRESS(1,COLUMN(),4),"1","")&4)+INDIRECT(SUBSTITUTE(ADDRESS(1,COLUMN(),4),"1","")&5)'), // =4(PC 流量) + 5(Mobile 流量)
      new DailyReportField("PC 流量", new HeaderStyle(), new ContentStyle(), "#,##0"),
      new DailyReportField("Mobile 流量", new HeaderStyle(), new ContentStyle(), "#,##0"),
      new DailyReportField("註冊數", new HeaderStyle(), new ContentStyle(), "#,##0")
    ]

    // 日流量公式分解說明:
    // 1. COLUMN() 函數會回傳目前單元格的列號碼。
    // 2. ADDRESS(1, COLUMN(), 4) 會以給定的行數(`COLUMN()` 的結果)和固定的列數(1)來生成一個絕對引用的地址。其中,第三個參數 4 表示不帶任何美元符號($)的相對地址。比如,如果你在第三列的任何單元格中使用這個函數,它會回傳 "C1"。
    // 3. SUBSTITUTE(ADDRESS(1, COLUMN(), 4), "1", "") 會將 ADDRESS 函數產生的地址中的數字 1 移除,因此只保留了列的英文字母,比如:"C"。
    // 4. INDIRECT(SUBSTITUTE(ADDRESS(1, COLUMN(), 4), "1", "") & 4) 這邊 & 4 其實應該是 &4。`SUBSTITUTE` 函數的結果會和數字 4 連接,形成 "C4" 這樣的字符串,然後 INDIRECT 函數會將這個字符串轉換成對應的單元格引用。所以,如果你在列 C 中的任何單元格使用此公式,它會引用 C4。
    // 5. 類似地,`INDIRECT(SUBSTITUTE(ADDRESS(1, COLUMN(), 4), "1", "") & 5)` 會引用相同列的第五行的單元格。比如,如果你在列 C 中的任何單元格使用此公式,它會引用 C5。
    // 6. 最後,這兩個 INDIRECT 函數引用的單元格值相加。
  }

  execute() {
    const sheet = this.getSheet();

  }

  // 取得給定日期的目標 Sheet
  getSheet() {
    // 以月來區分 Sheet,找到當月 Sheet
    var thisMonthSheet = this.separateSheet.getSheetByName(this.getSheetName());
    if (thisMonthSheet == null) {
      // 無則建立新的月 Sheet
      thisMonthSheet = this.makeMonthSheet();
    }

    return thisMonthSheet;
  }

  // 月 Sheet 命名規則
  getSheetName() {
    return Utilities.formatDate(this.date, "GMT+8", "yyyy-MM");
  }

  // 建立新的月 Sheet
  makeMonthSheet() {
    // 新增當月 Sheet,移動到第一個位子
    var thisMonthSheet = this.separateSheet.insertSheet(this.getSheetName(), {index: 0});
    thisMonthSheet.activate();
    this.separateSheet.moveActiveSheet(1);

    // 新增第一欄,欄位名稱、設定 Pinned、寬度 200
    thisMonthSheet.insertColumnsBefore(1, 1);
    thisMonthSheet.setFrozenColumns(1);
    thisMonthSheet.setColumnWidths(1, 1, 200);

    // 填充欄位名稱
    for(const currentRow in this.sheetFields) {
      const sheetField = this.sheetFields[currentRow];
      const text = sheetField.name;
      const style = sheetField.headerStyle;

      const range = thisMonthSheet.getRange(parseInt(currentRow) + 1, 1);
      this.setContent(range, text, style);
      range.setHorizontalAlignment("left");
    }

    // 設定欄高
    thisMonthSheet.setRowHeights(1, Object.keys(this.sheetFields).length, 30);

    // 設定 Pinned 第一、二列(日期、星期)
    thisMonthSheet.setFrozenRows(2);

    // 新增總計欄位
    thisMonthSheet.insertColumnsAfter(thisMonthSheet.getLastColumn(), 1); // 新增一欄在最後一欄
    const summaryColumnIndex = thisMonthSheet.getLastColumn() + 1;

    // 填充總計欄位
    for(const currentRow in this.sheetFields) {
      const sheetField = this.sheetFields[currentRow];
      const summaryRowIndex = parseInt(currentRow) + 1;

      const range = thisMonthSheet.getRange(summaryRowIndex, summaryColumnIndex);
      const style = sheetField.contentStyle;

      if (summaryRowIndex == 1) {
        // 日期...
        this.setContent(range, "總計", style);
      } else if (summaryRowIndex == 2) {
        // 星期...merge...
        const mergeRange = thisMonthSheet.getRange(1, summaryColumnIndex, summaryRowIndex, 1);
        this.setContent(mergeRange, "總計", style);
        mergeRange.merge();
      } else {
        this.setContent(range, '=IFERROR(SUM(INDIRECT(SUBSTITUTE(ADDRESS(1, 1, 4), "1", "") & '+summaryRowIndex+'):INDIRECT(SUBSTITUTE(ADDRESS(1, COLUMN() - 1, 4), "1", "") & '+summaryRowIndex+')), 0)', style);

        // 1. IFERROR(value, [value_if_error]) 函數用於判斷公式中是否存在錯誤,並在有錯誤時返回指定的值。它接受兩個參數:`value` 是需要計算的表達式或函數,`value_if_error` 是當 value 發生錯誤時返回的值。在這個情境下,如果 SUM 函數中的計算發生錯誤,則返回 0。
        // 2. SUM(range) 函數用於計算範圍內所有數字的總和。
        // 3. INDIRECT(ref_text, [is_A1_notation]) 函數將文字字串轉換成單元格引用。這裡使用 INDIRECT 函數是為了動態生成所需的參照範圍。
        // 4. SUBSTITUTE(text, old_text, new_text, [instance_num]) 函數在文字字串中替換指定的文字。這裡使用 SUBSTITUTE 是為了將 ADDRESS 函數回傳的地址中的 "1" 替換成其他內容。
        // 5. ADDRESS(row, column, [abs_num], [a1], [sheet]) 函數根據給定的行列號碼回傳對應的單元格地址。在這裡,ADDRESS(1, 1, 4) 生成了第一行第一列的單元格地址,但是由於 abs_num 是 4,所以地址不包含工作表名稱和固定符號 $。類似地,`ADDRESS(1, COLUMN() - 1, 4)` 產生了從第一行到當前列前一列的單元格地址。
        // 6. COLUMN() 函數回傳當前單元格的列號。
        // 7. summaryRowIndex = 所在列

      }
    }

    return thisMonthSheet;
  }

  setContent(range, text, style) {
    if (String(text) != "") {
      range.setValue(text);
    }

    range.setBackgroundColor(style.backgroundColor);
    range.setFontColor(style.color);

    if (style.bold) {
      range.setFontWeight("bold");
    }

    range.setHorizontalAlignment(style.horizontalAlignment);
    range.setVerticalAlignment(style.verticalAlignment);
    range.setFontSize(style.size);
    range.setBorder(true, true, true, true, true, true, "black", SpreadsheetApp.BorderStyle.SOLID);
  }
}
Main.gs 做為主程式入口:
const targetGoogleSheetID = "1-9lZCpsu3E7eDmO-lMkXJXQ6Y6KK4SiyU6uBODcDcFE"
// https://docs.google.com/spreadsheets/d/1-9lZCpsu3E7eDmO-lMkXJXQ6Y6KK4SiyU6uBODcDcFE/edit#gid=275710641

function debug() {
  var report = new DailyReport(targetGoogleSheetID, new Date());
  report.execute();
}
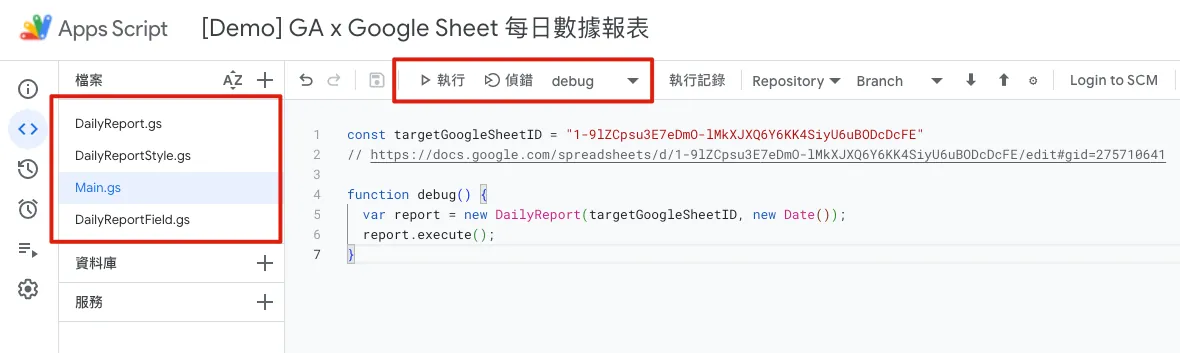
完成後我們回到「 Main.gs 」選擇「debug」並按下偵錯,查看執行結果是否正確、有無出錯。
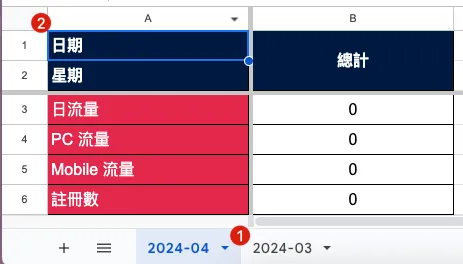
執行正確回到報表會出現當前新月份,並帶入預設欄位與總計欄位,如果已存在則不會有反應。
3. 串接 Google Analytics 撈取數據
首先需要新增「AnalyticsData」服務:
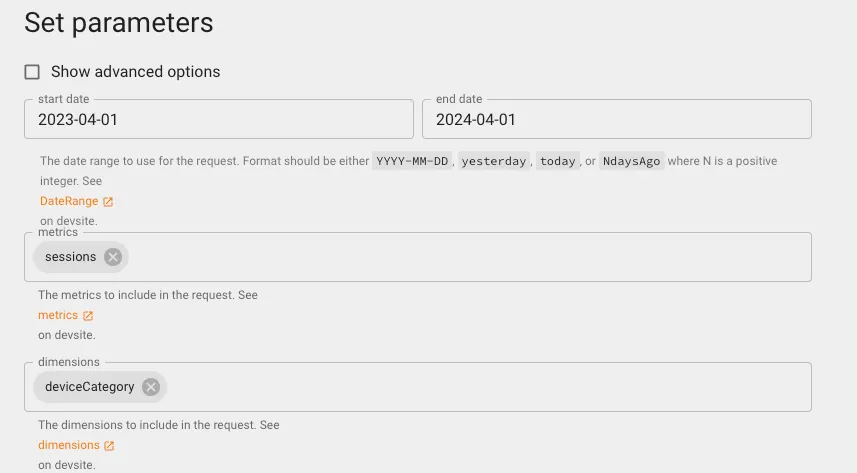
使用 GA4 Debug Tool 構建查詢條件:
- https://ga-dev-tools.google/ga4/query-explorer/
- 可邊比照 GA 4 後台篩選條件構建
- 本文以查詢 Sessions 數為例,區分裝置 Grouping
登入授權後選擇目標資源:
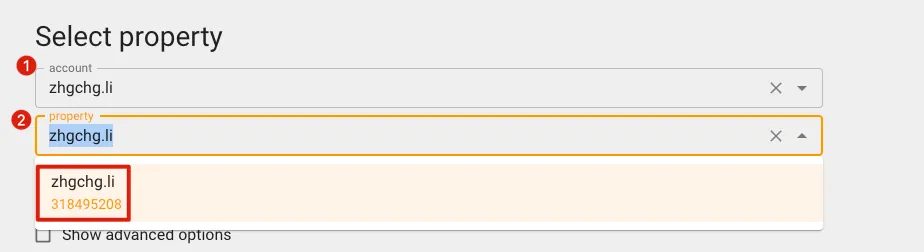
記下 property 底下顯示的數字,即為你要查詢的資源 GA Property ID。
設定查詢參數、Filter 條件:
按下「Make Reqeust」取得 Response 結果:
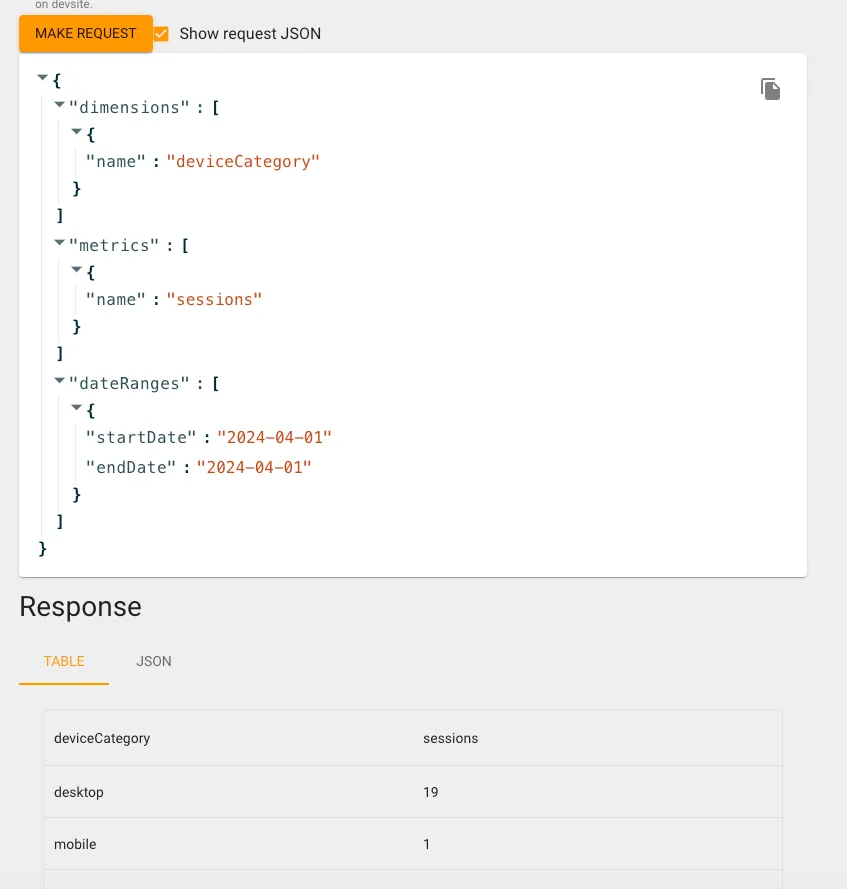
可同步比較 GA 4 後台同樣條件的數據是否相同,如果落差太大可能是有 Filter 條件沒有加到,要再檢查一下。
小記
附上一個行銷同事發現的小坑,GA 有些數據會有延遲問題,可能今天查的跟昨天查的數字會不一樣(例如跳出率),因此最好能將資料回溯幾天才能卻保值是最終的數字。
GA Debug Tool 沒問題之後我們就能將它轉換為 Google Apps Script。
新增一個 GAData.gs 檔案:
// Remeber add Google Analytics Data API to Services, or you'll see this error: ReferenceError: AnalyticsData is not defined
// GA Debug Toole: https://ga-dev-tools.web.app/ga4/query-explorer/

class GAData {
  constructor(date) {
    this.date = date;

    const traffic = this.fetchGADailyUsage();
    this.pc_traffic = traffic["desktop"];
    this.mobile_traffic = traffic["mobile"];
  }

  fetchGADailyUsage() {
    const dimensionPlatform = AnalyticsData.newDimension();
    dimensionPlatform.name = "deviceCategory";

    const metric = AnalyticsData.newMetric();
    metric.name = "sessions";

    const dateRange = AnalyticsData.newDateRange();
    // 預設查詢給定日範圍內資料 e.g. 2024-01-01 ~ 2024-01-01
    dateRange.startDate = this.getDateString();
    dateRange.endDate = this.getDateString();

    // Filter Example:
    // const filterExpression = AnalyticsData.newFilterExpression();
    // const filter = AnalyticsData.newFilter();
    // filter.fieldName = "landingPagePlusQueryString";
    // const stringFilter = AnalyticsData.newStringFilter()
    // stringFilter.value = "/life|/article|/chat|/house|/event/230502|/event/230310";
    // stringFilter.matchType = "PARTIAL_REGEXP";
    // filter.stringFilter = stringFilter;
    // filterExpression.filter = filter;

    const request = AnalyticsData.newRunReportRequest();
    request.dimensions = [dimensionPlatform];
    request.metrics = [metric];
    request.dateRanges = dateRange;

    // Filter Example:
    // const filterExpression = AnalyticsData.newFilterExpression();
    // filterExpression.expression = filterExpression;
    // request.dimensionFilter = filterExpression;
    // or Not
    // const notFilterExpression = AnalyticsData.newFilterExpression();
    // notFilterExpression.notExpression = filterExpression;
    // request.dimensionFilter = notFilterExpression;

    const report = AnalyticsData.Properties.runReport(request, "properties/" + gaPropertyId).rows;
    // 無資料
    if (report == undefined) {
      return {"desktop": 0, "mobile": 0};
    }

    // [{metricValues=[{value=4517}], dimensionValues=[{value=mobile}]}, {metricValues=[{value=3189}], dimensionValues=[{value=desktop}]}, {metricValues=[{value=63}], dimensionValues=[{value=tablet}]}]

    var result = {};
    report.forEach(function(element) {
      result[element.dimensionValues[0].value] = element.metricValues[0].value;
    });

    return result;
  }

  getDateString() {
    return Utilities.formatDate(this.date, "GMT+8", "yyyy-MM-dd");
  }
}
Main.gs 新增測試內容:
const targetGoogleSheetID = "1-9lZCpsu3E7eDmO-lMkXJXQ6Y6KK4SiyU6uBODcDcFE";
// https://docs.google.com/spreadsheets/d/1-9lZCpsu3E7eDmO-lMkXJXQ6Y6KK4SiyU6uBODcDcFE/edit#gid=275710641

const gaPropertyId = "318495208";

function debug() {
  var report = new DailyReport(targetGoogleSheetID, new Date());
  report.execute();
  //
  var gaData = new GAData(new Date());
  Logger.log(gaData);
}
按下執行或偵錯取得程式撈取結果:
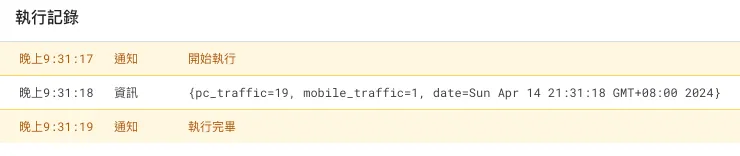
OK! 比對相符。
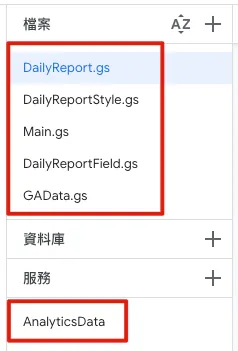
此步驟完成時,目錄檔案結構如上圖。
4. 填充資料
建好 Sheet、查好資料後,再來就是填充資料到欄位中。
調整 DailyReport.gs 增加 by 日期新增欄位&填充資料的邏輯:
class DailyReport {
  constructor(sheetID, date, gaData, inHouseReportData) {
    this.separateSheet = SpreadsheetApp.openById(sheetID);
    this.date = date;

    const dateString = Utilities.formatDate(date, "GMT+8", "yyyy/MM/dd");
    const weekString = ["星期日", "星期一","星期二","星期三","星期四","星期五","星期六"][date.getDay()]; // 取得星期,星期日為0,星期一為1,以此類

    this.sheetFields = [
      new DailyReportField("日期", new HeaderDateStyle(), new HeaderDateStyle(), null, dateString),
      new DailyReportField("星期", new HeaderDateStyle(), new HeaderDateStyle(), null, weekString),
      new DailyReportField("日流量", new HeaderStyle(), new ContentStyle(), "#,##0", '=INDIRECT(SUBSTITUTE(ADDRESS(1,COLUMN(),4),"1","")&4)+INDIRECT(SUBSTITUTE(ADDRESS(1,COLUMN(),4),"1","")&5)'), // =4(PC 流量) + 5(Mobile 流量)
      new DailyReportField("PC 流量", new HeaderStyle(), new ContentStyle(), "#,##0", gaData.pc_traffic),
      new DailyReportField("Mobile 流量", new HeaderStyle(), new ContentStyle(), "#,##0", gaData.mobile_traffic),
      new DailyReportField("註冊數", new HeaderStyle(), new ContentStyle(), "#,##0", inHouseReportData.registers)
    ]
  }

  execute() {
    const sheet = this.getSheet();
    const dateColumnIndex = this.makeOrGetDateColumn(sheet); // 取得已存在的更新或建立新的欄位

    // 填充欄位內容
    for(const currentRow in this.sheetFields) {
      const sheetField = this.sheetFields[currentRow];
      const rowIndex = parseInt(currentRow) + 1;

      if (rowIndex != null) {
        const range = sheet.getRange(rowIndex, dateColumnIndex);
        const text = sheetField.value;
        const style = sheetField.contentStyle;
        this.setContent(range, text, style);
        this.setFormat(range, sheetField.format);
      }
    }
  }

  // 取得給定日期的目標 Sheet
  getSheet() {
    // 以月來區分 Sheet,找到當月 Sheet
    var thisMonthSheet = this.separateSheet.getSheetByName(this.getSheetName());
    if (thisMonthSheet == null) {
      // 無則建立新的月 Sheet
      thisMonthSheet = this.makeMonthSheet();
    }

    return thisMonthSheet;
  }

  // 月 Sheet 命名
  getSheetName() {
    return Utilities.formatDate(this.date, "GMT+8", "yyyy-MM");
  }

  // 建立新的月 Sheet
  makeMonthSheet() {
    // 新增當月 Sheet,移動到第一個位子
    var thisMonthSheet = this.separateSheet.insertSheet(this.getSheetName(), {index: 0});
    thisMonthSheet.activate();
    this.separateSheet.moveActiveSheet(1);

    // 新增第一欄,欄位名稱、設定 Pinned、寬度 200
    thisMonthSheet.insertColumnsBefore(1, 1);
    thisMonthSheet.setFrozenColumns(1);
    thisMonthSheet.setColumnWidths(1, 1, 200);

    // 填充欄位名稱
    for(const currentRow in this.sheetFields) {
      const sheetField = this.sheetFields[currentRow];
      const text = sheetField.name;
      const style = sheetField.headerStyle;

      const range = thisMonthSheet.getRange(parseInt(currentRow) + 1, 1);
      this.setContent(range, text, style);
      range.setHorizontalAlignment("left");
    }

    // 設定欄高
    thisMonthSheet.setRowHeights(1, Object.keys(this.sheetFields).length, 30);

    // 設定 Pinned 第一、二列(日期、星期)
    thisMonthSheet.setFrozenRows(2);

    // 新增總計欄位
    thisMonthSheet.insertColumnsAfter(thisMonthSheet.getLastColumn(), 1); // 新增一欄在最後一欄
    const summaryColumnIndex = thisMonthSheet.getLastColumn() + 1;

    // 填充總計欄位
    for(const currentRow in this.sheetFields) {
      const sheetField = this.sheetFields[currentRow];
      const summaryRowIndex = parseInt(currentRow) + 1;

      const range = thisMonthSheet.getRange(summaryRowIndex, summaryColumnIndex);
      const style = sheetField.contentStyle;

      if (summaryRowIndex == 1) {
        // 日期...
        this.setContent(range, "總計", style);
      } else if (summaryRowIndex == 2) {
        // 星期...merge...
        const mergeRange = thisMonthSheet.getRange(1, summaryColumnIndex, summaryRowIndex, 1);
        this.setContent(mergeRange, "總計", style);
        mergeRange.merge();
      } else {
        this.setContent(range, '=IFERROR(SUM(INDIRECT(SUBSTITUTE(ADDRESS(1, 1, 4), "1", "") & '+summaryRowIndex+'):INDIRECT(SUBSTITUTE(ADDRESS(1, COLUMN() - 1, 4), "1", "") & '+summaryRowIndex+')), 0)', style);
      }
    }

    return thisMonthSheet;
  }

  // 建立或取得日期的欄位
  // 從最近一日往後加一欄位
  makeOrGetDateColumn(sheet) {
    const firstRowColumnsRange = sheet.getRange(1, 1, 1, sheet.getLastColumn()); // 取得第一列(日期)資料範圍
    const firstRowColumns = firstRowColumnsRange.getValues()[0]; // 取得資料範圍的值 0 = 第一列

    var columnIndex = firstRowColumns.findIndex((date) => (date instanceof Date && Utilities.formatDate(date, "GMT+8", "yyyy/MM/dd") == Utilities.formatDate(this.date, "GMT+8", "yyyy/MM/dd"))); // 找到對應日期的欄位 Index

    if (columnIndex < 0) {
      // Not Found,找到前一日的位子
      var preDate = new Date(this.date);
      preDate.setDate(preDate.getDate() - 1);

      while(preDate.getMonth() == this.date.getMonth()) {
        columnIndex = firstRowColumns.findIndex((date) => (date instanceof Date && Utilities.formatDate(date, "GMT+8", "yyyy/MM/dd") == Utilities.formatDate(preDate, "GMT+8", "yyyy/MM/dd")));
        if (columnIndex >= 0) {
          break;
        }

        preDate.setDate(preDate.getDate() - 1);
      }

      if (columnIndex >= 0) {
        columnIndex += 1;
        sheet.insertColumnsAfter(columnIndex, 1); // 在前一日欄位後新增一欄
        columnIndex += 1;
      }
    } else {
      columnIndex += 1;
    }

    if (columnIndex < 0) {
        sheet.insertColumnsAfter(1, 1); // 默認,直接新增一欄在第一欄後面
        columnIndex = 2;
    }

    // 設定欄位寬度
    sheet.setColumnWidths(columnIndex , 1, 100);

    return columnIndex
  }

  // 設定欄位 Format 樣式
  setFormat(range, format) {
    if (format != null) {
      range.setNumberFormat(format);
    }
  }

  // 填充內容到欄位
  setContent(range, text, style) {
    if (String(text) != "") {
      range.setValue(text);
    }

    range.setBackgroundColor(style.backgroundColor);
    range.setFontColor(style.color);

    if (style.bold) {
      range.setFontWeight("bold");
    }

    range.setHorizontalAlignment(style.horizontalAlignment);
    range.setVerticalAlignment(style.verticalAlignment);
    range.setFontSize(style.size);
    range.setBorder(true, true, true, true, true, true, "black", SpreadsheetApp.BorderStyle.SOLID);
  }
}
調整 Main.gs 增加資料串接並在構建階段賦值:
const targetGoogleSheetID = "1-9lZCpsu3E7eDmO-lMkXJXQ6Y6KK4SiyU6uBODcDcFE";
// https://docs.google.com/spreadsheets/d/1-9lZCpsu3E7eDmO-lMkXJXQ6Y6KK4SiyU6uBODcDcFE/edit#gid=275710641

const gaPropertyId = "318495208";

function debug() {
  const date = new Date();
  const gaData = new GAData(date);
  const inHouseReportData = fetchInHouseReportData(date);

  const report = new DailyReport(targetGoogleSheetID, date, gaData, inHouseReportData);
  report.execute();

}

// 模擬部分數據資料可能是打其他平台 API 取得的。
function fetchInHouseReportData(date) {
  // EXMAPLE REQUEST:
  // var options = {
  //   'method' : 'get',
  //   'headers': {
  //       'Authorization':  'Bearer XXX'
  //   }
  // };
  // OR
  // var options = {
  //   'method' : 'post',
  //   'headers': {
  //       'Authorization':  'Bearer XXX'
  //   },
  //   'payload' : data
  // };

  // var res = UrlFetchApp.fetch(url, options);
  // const result = JSON.parse(res.getContentText());

  // REMEMBER, DUE TO SECURITY REASON, We can't customize user-agent.

  return {"registers": Math.floor(Math.random() * (180 - 30 + 1)) + 30} // MOCK DATA random 30~180
}
完成後我們回到「 Main.gs 」選擇「debug」並按下偵錯,查看執行結果是否正確、有無出錯。
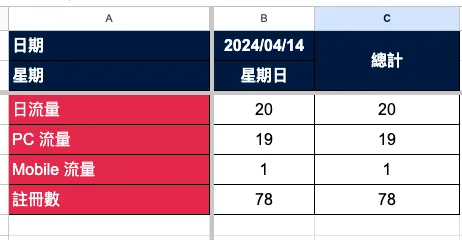
回到 Google Sheet! 成功! 我們成功的自動新增了該日期的資料。
5. 設定排程,每日自動執行
腳本完成後,再來只要設定自動觸發條件,就能每日自動完成囉。
調整 Main.gs 新增 cronjob() function:
const targetGoogleSheetID = "1-9lZCpsu3E7eDmO-lMkXJXQ6Y6KK4SiyU6uBODcDcFE";
// https://docs.google.com/spreadsheets/d/1-9lZCpsu3E7eDmO-lMkXJXQ6Y6KK4SiyU6uBODcDcFE/edit#gid=275710641

const gaPropertyId = "318495208";

function debug() {
  cronjob();
}

// 照現實狀況來說,通常是今日查昨日數據,才是完整的資料
function cronjob() {
  const yesterday = new Date();
  yesterday.setDate(yesterday.getDate() - 1);

  const gaData = new GAData(yesterday);
  const inHouseReportData = fetchInHouseReportData(yesterday);

  const report = new DailyReport(targetGoogleSheetID, yesterday, gaData, inHouseReportData);
  report.execute();
}

// 模擬部分數據資料可能是打其他平台 API 取得的。
function fetchInHouseReportData(date) {
  // EXMAPLE REQUEST:
  // var options = {
  //   'method' : 'get',
  //   'headers': {
  //       'Authorization':  'Bearer XXX'
  //   }
  // };
  // OR
  // var options = {
  //   'method' : 'post',
  //   'headers': {
  //       'Authorization':  'Bearer XXX'
  //   },
  //   'payload' : data
  // };

  // var res = UrlFetchApp.fetch(url, options);
  // const result = JSON.parse(res.getContentText());

  // REMEMBER, DUE TO SECURITY REASON, We can't customize user-agent.

  return {"registers": Math.floor(Math.random() * (180 - 30 + 1)) + 30} // MOCK DATA random 30~180
}
在編輯器上切換到「觸發條件」頁籤,選擇右下角「新增觸發條件」:
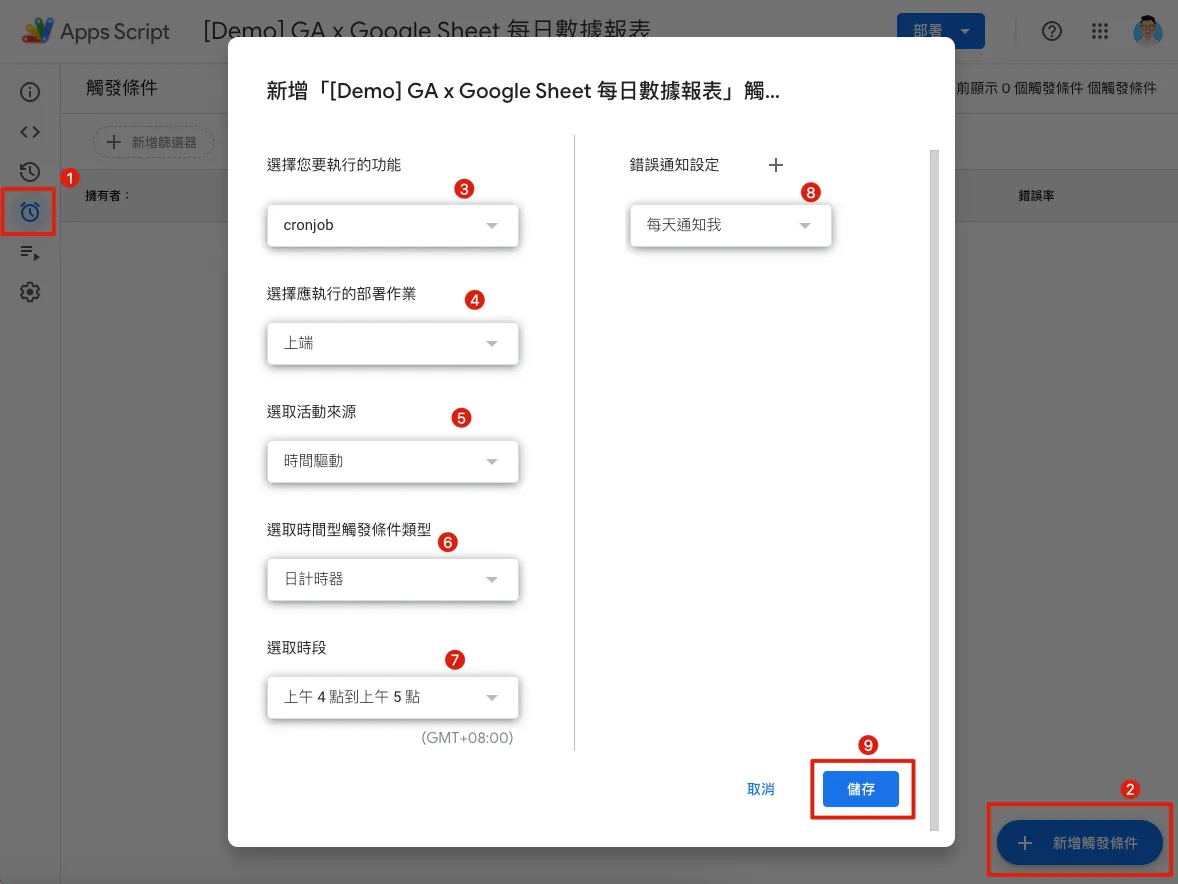
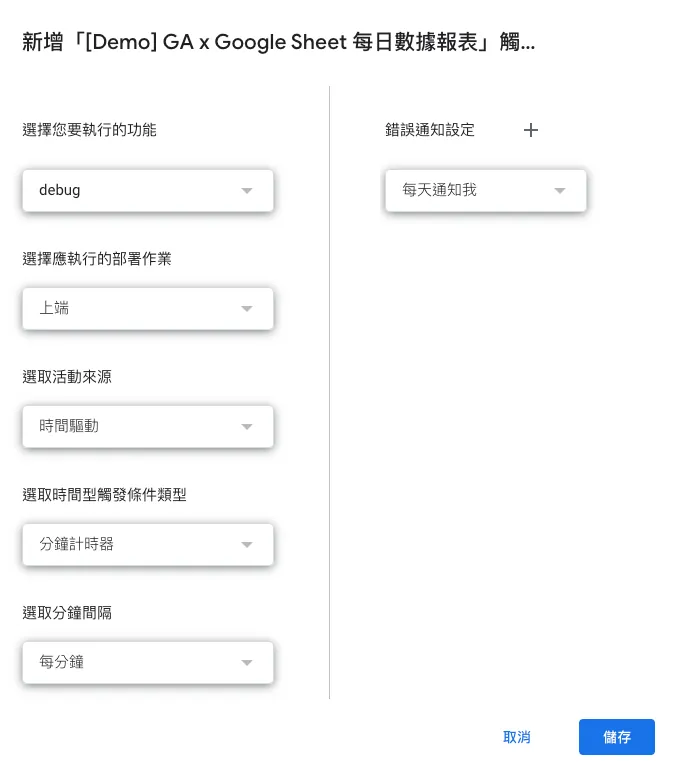
- 選擇您要執行的功能:剛新增的
Main.gsFunctioncronjob - 選擇應執行的部署作業:上端 (Head, 意為最新版)
- 選取活動來源:時間驅動
- 選取時間型觸發條件類型:日計時器
- 選取時段:AM 4:00 — AM 5:00 (GMT+08:00) 通常在 AM 4:00 一到就會執行。
- 錯誤通知設定:當腳本發生錯誤時是要馬上通知,還是每日彙整一次
儲存設定,完成。
之後可以去「執行項目」頁籤查看執行紀錄結果:
至此我們已完成自動化查詢、新增資料、填入資料的報表 RPA 功能.🎉🎉🎉
搭建 Web GUI Dashboard
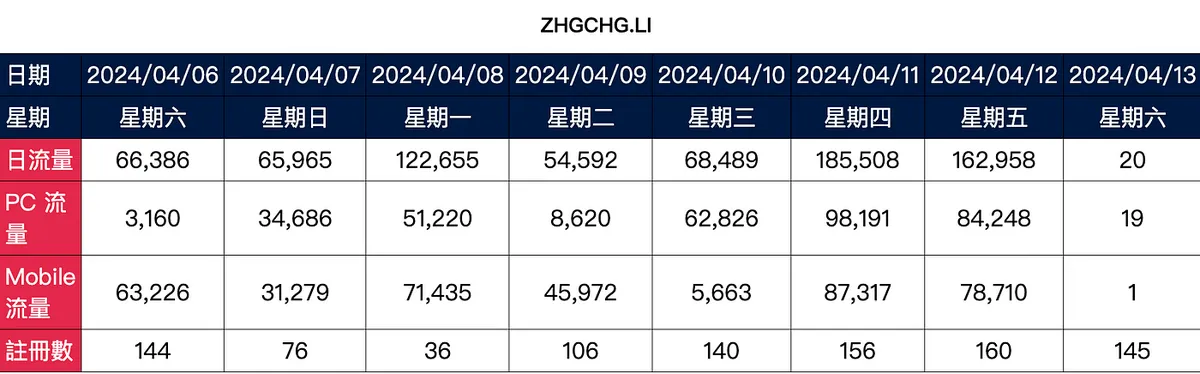
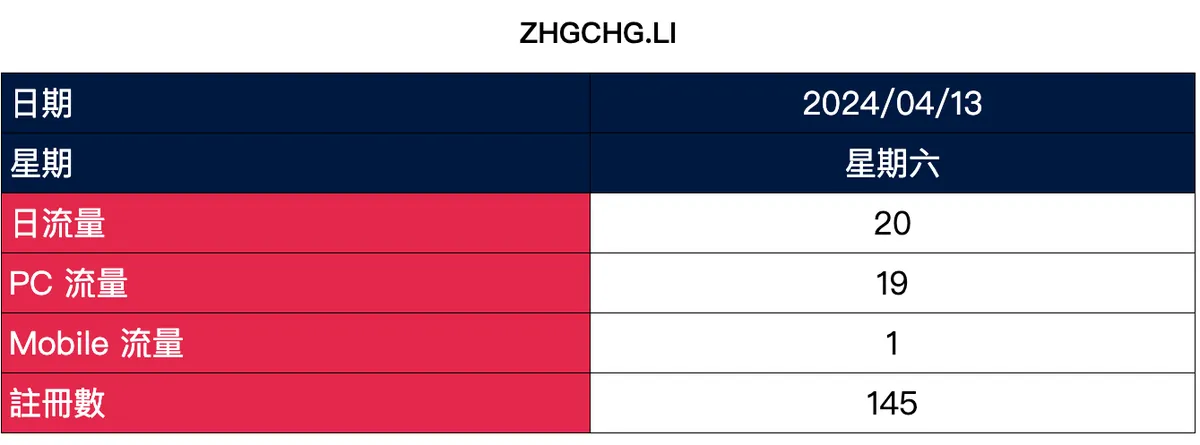
再來有個次要需求,我們需要建立一個簡單的 Web 呈現每日數據(類似戰情中心的概念)會在團隊背後牆上大螢幕上直接顯示。
效果如下圖:
新增 Web_DailyReport.gs 撰寫讀取 Google Sheet 並將欄位、樣式轉換為 HTML 格式呈現:
class WebDailyReport {
  constructor(sheetID, dayCount) {
    this.separateSheet = SpreadsheetApp.openById(sheetID);
    this.dayCount = dayCount;
    this.sheetRows = [
      "日期",
      "星期",
      "日流量",
      "PC 流量",
      "Mobile 流量",
      "註冊數"
    ];
  }

  allData(startDate) {
    var sheetRowsIndexs = {};
    var count = this.dayCount;
    var result = [];
    while (count >= 0) {
      const preDate = new Date(startDate);
      preDate.setDate(preDate.getDate() - (this.dayCount - count));
      const sheetName = Utilities.formatDate(preDate, "GMT+8", "yyyy-MM");
      const targetSheet = this.separateSheet.getSheetByName(sheetName);
      if (targetSheet != null) {
        const firstRowColumnsRange = targetSheet.getRange(1, 1, 1, targetSheet.getLastColumn()); // 取得第一列(日期)資料範圍
        const firstRowColumns = firstRowColumnsRange.getValues()[0]; // 取得資料範圍的值 0 = 第一列
        var columnIndex = firstRowColumns.findIndex((date) => (date instanceof Date && Utilities.formatDate(date, "GMT+8", "yyyy/MM/dd") == Utilities.formatDate(preDate, "GMT+8", "yyyy/MM/dd"))); // 找到對應日期的欄位 Index

        if (columnIndex >= 0) {
          columnIndex = parseInt(columnIndex) + 1;
          if (sheetRowsIndexs[sheetName] == undefined || sheetRowsIndexs[sheetName] == null) {
            sheetRowsIndexs[sheetName] = this.sheetRows.map((sheetRow) => this.getFieldRow(targetSheet, sheetRow));
          }

          if (result.length == 0) {
            // 新增第一欄
            const ranges = sheetRowsIndexs[sheetName].map((rowIndex) => (rowIndex != null) ? (targetSheet.getRange(rowIndex, 1)) : (null));
            result.push(this.makeValues(ranges));
          }

          const ranges = sheetRowsIndexs[sheetName].map((rowIndex) => (rowIndex != null) ? (targetSheet.getRange(rowIndex, columnIndex)) : (null));
          result.push(this.makeValues(ranges));
        }
      }

      count -= 1;
    }

    var transformResult = {};
    for (const columnIndex in result) {
      for (const rowIndex in result[columnIndex]) {
        if (transformResult[rowIndex] == undefined) {
          transformResult[rowIndex] = [];
        }

        if (columnIndex == 0) {
          transformResult[rowIndex].unshift(result[columnIndex][rowIndex]);
        } else {
          transformResult[rowIndex].splice(1, 0, result[columnIndex][rowIndex]);
        }

      }
    }

    return transformResult;
  }

  // 轉換 欄位屬性 值成 顯示用物件
  makeValues(ranges) {
    const data = ranges.map((range) => (range != null) ? (range.getDisplayValues()) : (null)).map((values) => (values != null) ? (values[0][0]) : (null));
    const backgroundColors = ranges.map((range) => (range != null) ? (range.getBackgrounds()) : (null)).map((values) => (values != null) ? (values[0][0]) : (null));
    const colors = ranges.map((range) => (range != null) ? (range.getFontColorObjects()) : (null)).map((values) => (values != null) ? (values[0][0]) : (null));
    const sizes = ranges.map((range) => (range != null) ? (range.getFontSizes()) : (null)).map((values) => (values != null) ? (values[0][0]) : (null));
    const bolds = ranges.map((range) => (range != null) ? (range.getFontWeights()) : (null)).map((values) => (values != null) ? (values[0][0]) : (null));
    const horizontalAlignments = ranges.map((range) => (range != null) ? (range.getHorizontalAlignments()) : (null)).map((values) => (values != null) ? (values[0][0]) : (null));
    const verticalAlignments = ranges.map((range) => (range != null) ? (range.getVerticalAlignments()) : (null)).map((values) => (values != null) ? (values[0][0]) : (null));

    var result = [];
    for(const index in data) {
        const row = data[index];
        result.push({
          "value": row,
          "backgroundColor": backgroundColors[index],
          "color": this.colorStripper(colors[index]?.asRgbColor()?.asHexString()),
          "size": sizes[index],
          "bold": bolds[index],
          "horizontalAlignment": this.alignConventer(horizontalAlignments[index]),
          "verticalAlignment": verticalAlignments[index]
        });
    }

    return result;
  }

  colorStripper(colorString) {
    if (colorString == undefined || colorString == null) {
      return null
    }

    if (colorString.length == 9) {
      return "#"+colorString.substring(3, 9);
    } else {
      return colorString;
    }
  }

  alignConventer(horizontalAlignment) {
    if (horizontalAlignment == undefined || horizontalAlignment == null) {
      return null
    }

    return horizontalAlignment.replace('general-', '')
  }

  getFieldRow(sheet, name) {
    const firstColumnRowsRange = sheet.getRange(1, 1, sheet.getLastRow(), 1); // 取得第一欄(欄位)資料範圍
    const firstColumnRows = firstColumnRowsRange.getValues(); // 取得資料範圍的值
    const foundIndex = firstColumnRows.findIndex((firstColumnRow) => firstColumnRow[0] == name);

    if (foundIndex < 0) {
      return null;
    } else {
      return foundIndex + 1;
    }
  }
}
Main.gs 增加 Web 請求 Handle:
const targetGoogleSheetID = "1-9lZCpsu3E7eDmO-lMkXJXQ6Y6KK4SiyU6uBODcDcFE";
// https://docs.google.com/spreadsheets/d/1-9lZCpsu3E7eDmO-lMkXJXQ6Y6KK4SiyU6uBODcDcFE/edit#gid=275710641

const gaPropertyId = "318495208";

function debug() {
  cronjob();
}

function cronjob() {
  const yesterday = new Date();
  yesterday.setDate(yesterday.getDate() - 1);

  const gaData = new GAData(yesterday);
  const inHouseReportData = fetchInHouseReportData(yesterday);

  const report = new DailyReport(targetGoogleSheetID, yesterday, gaData, inHouseReportData);
  report.execute();
}

function doGet(e) {
  return HtmlService.createTemplateFromFile('Web_DailyReport_ Scaffolding').evaluate();
}

function getDailyReportBody() {
  const html = HtmlService.createTemplateFromFile('Web_DailyReport_Body').evaluate().getContent();
  return html;
}

// FOR POST
// function doPost(e) {
//  ref: https://developers.google.com/apps-script/guides/web?hl=zh-tw
// }


// 模擬部分數據資料可能是打其他平台 API 取得的。
function fetchInHouseReportData(date) {
  // EXMAPLE REQUEST:
  // var options = {
  //   'method' : 'get',
  //   'headers': {
  //       'Authorization':  'Bearer XXX'
  //   }
  // };
  // OR
  // var options = {
  //   'method' : 'post',
  //   'headers': {
  //       'Authorization':  'Bearer XXX'
  //   },
  //   'payload' : data
  // };

  // var res = UrlFetchApp.fetch(url, options);
  // const result = JSON.parse(res.getContentText());

  // REMEMBER, DUE TO SECURITY REASON, We can't customize user-agent.

  return {"registers": Math.floor(Math.random() * (180 - 30 + 1)) + 30} // MOCK DATA random 30~180
}
新增 Web_DailyReport_ Scaffolding.html Web Dashboard 框架,由於我們的戰情室螢幕要做到自動更新內容,因此我們建立一個 Web 骨架,在其中定時用 Ajax 去撈取 HTML 內容:
<!DOCTYPE html>
<html>
  <head>
    <base target="_top">
    <script>
      function onSuccess(html) {
        if (html != null) {
          var div = document.getElementById('result');
          div.innerHTML = html;
        }
     }
     setInterval(()=>{
       google.script.run.withSuccessHandler(onSuccess).getDailyReportBody()
     }, 1000 * 60 * 60 * 1);
     google.script.run.withSuccessHandler(onSuccess).getDailyReportBody();
    </script>
  </head>
  <body>
    <div id="result">Loading...</div>
  </body>
</html>
新增 Web_DailyReport_Body.html 實際渲染資料成 HTML 的地方:
<!DOCTYPE html>
<html>
  <head>
    <base target="_top">
    <style>
    table {
        border-collapse: collapse;
        width: 100%;
        text-align: center;
    }
    th, td {
        border: 1px solid #000000;
        padding: 8px;
        text-align: center;
        font-size: 36px;
    }
      </style>
  </head>
  <body>
      <h1 style="text-align:center">ZHGCHG.LI</h1>
      <table id="dataTable">
        <tbody>
          <?
          // 顯示近 7 天數據
          const dashboard = new WebDailyReport(targetGoogleSheetID, 7);
          // 從昨天開始
          const yesterday = new Date();
          yesterday.setDate(yesterday.getDate() - 1);
          const data = dashboard.allData(yesterday);
          for(const rowIndex in data) {
            const row = data[rowIndex];
            ?>
            <tr>
              <?
              for(const columnIndex in row) {
                const column = row[columnIndex];
                ?>
                <td style="background-color: <?=column["backgroundColor"]?>; color: <?=column["color"]?>; text-align: <?=column["horizontalAlignment"]?>;">
                  <?=column["value"]?>
                </td>
                <?
              }
              ?>
            </tr>
            <?
          }
          ?>
        </tbody>
      </table>
      <script>
  </body>
</html>
請注意,我們是從昨天開始往後撈 7 天的數據做比對,不會顯示今天的數據。
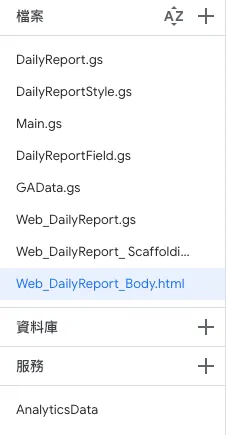
完成以上步驟後的專案檔案目錄如下:
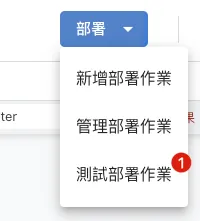
測試部署:
點擊專案右上角「部署」->「測試部署作業」
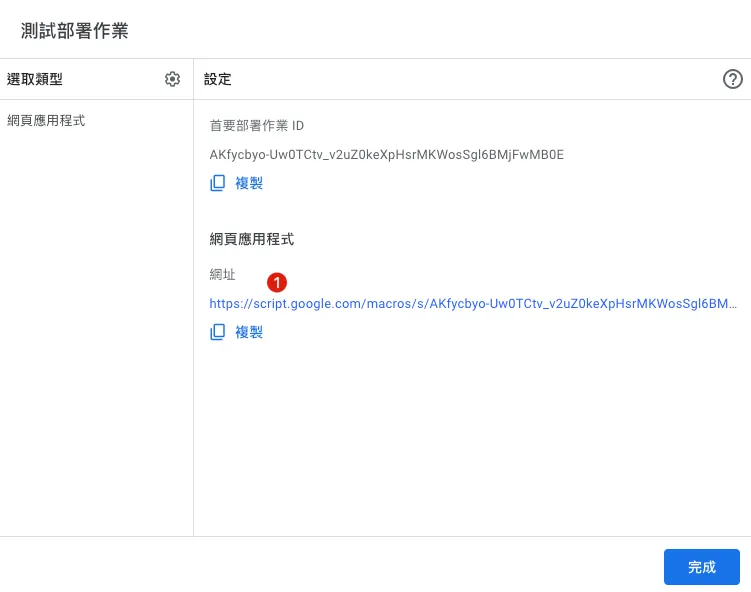
- 部署完成點擊網址即可查看測試結果。
- 請注意此網址僅共一次性測試使用,如果程式碼有調整要再重新點一次測試部署作業。
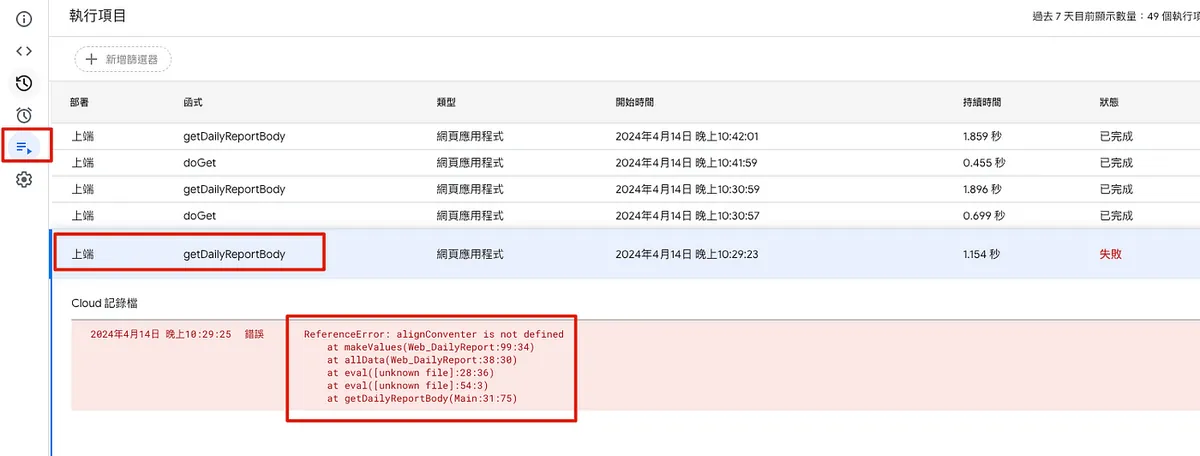
卡在 Loading… 內容沒出來或出現伺服器錯誤,可以回到編輯器的「執行項目」頁籤查看錯誤訊息:
完成正式部署:
如果測試沒問題就可以完成正式部署,釋出網址。
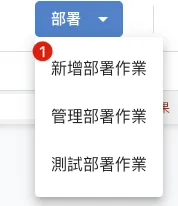
點擊專案右上角「部署」->「新增部署作業」-> 左上角「選取類型」->「網頁應用程式」:
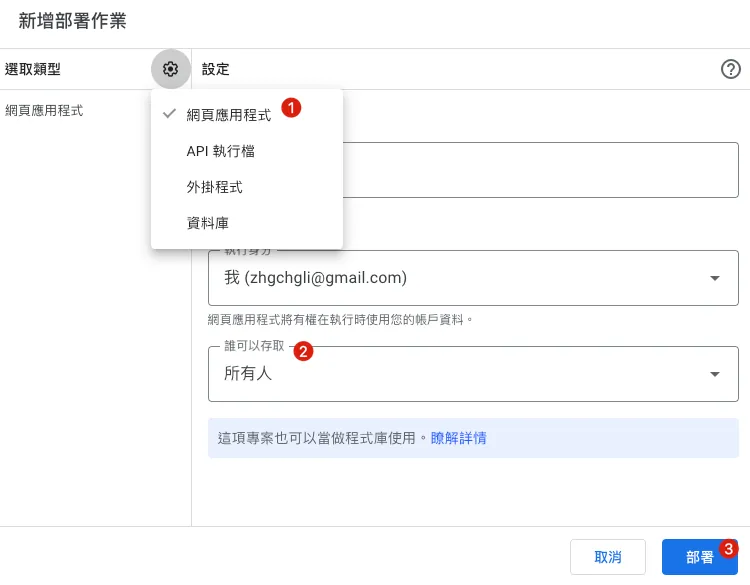
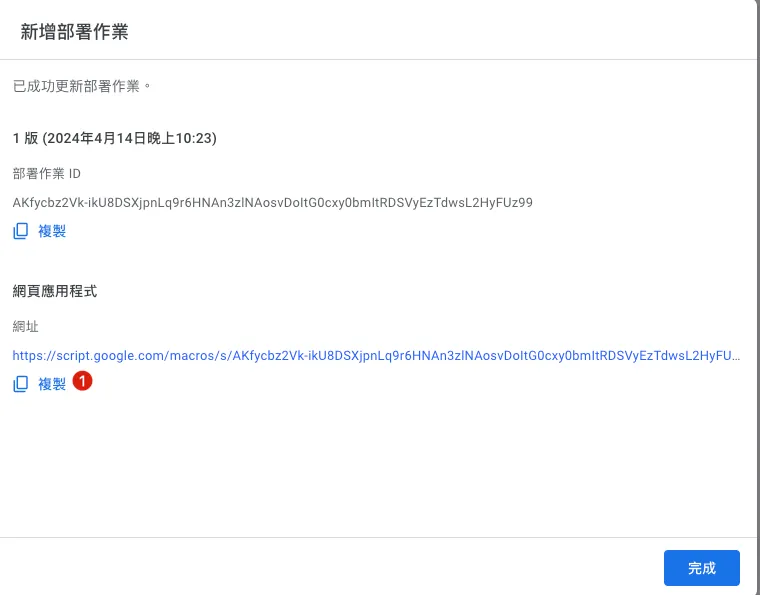
- 執行身份:預設為當前帳號(同 Google Apps Script 使用者)
- 誰可以存取:設為所有人只要知道網址的人都能存取、也可設為僅組織可存取,會先要求 Google 登入才能存取。
- 部署完成,取得網址。
程式碼有更動需重新部署才會生效:
請注意當程式碼有變動時,需要重新部署(網址不會變),更動才會生效,否則會一直是舊的。
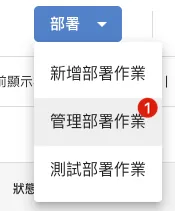
點擊專案右上角「部署」->「管理部署作業」:
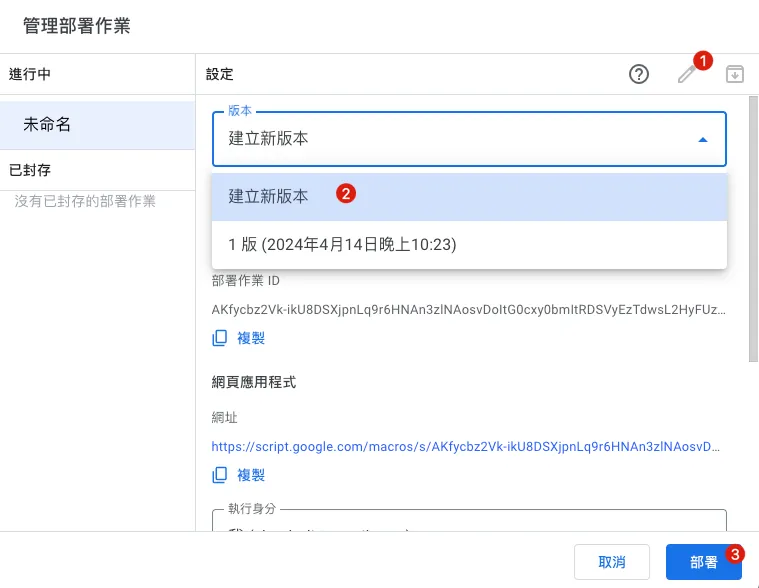
點擊右上角「筆🖊️ ICON」-> 「版本」 ->「建立新版本」->「部署」。
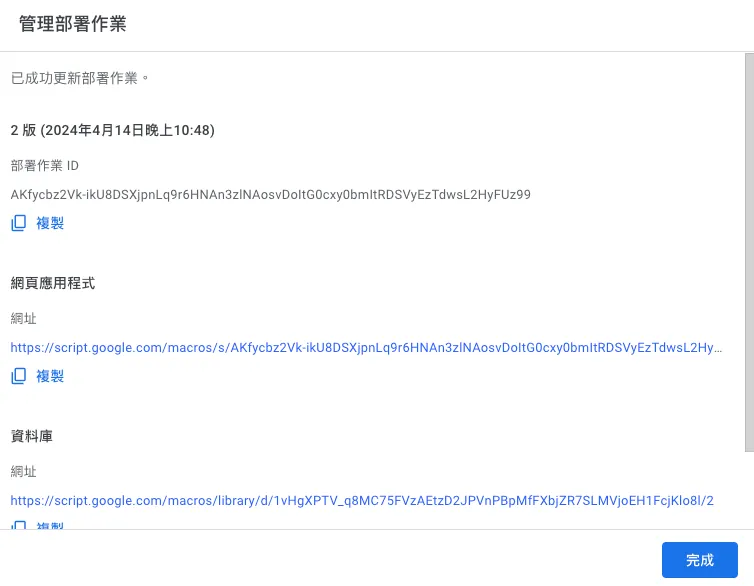
部署完成後點擊網址,或回到原網址重新整理即可看到新的更動結果。
🎉🎉完成!至此我們所有的 RPA 需求皆已完成。🎉🎉
最終成果:
(改程式回補本月數據,否則全新資料下只有昨日一筆)
完整 Google Sheet Demo:
- Google Sheet: https://docs.google.com/spreadsheets/d/1-9lZCpsu3E7eDmO-lMkXJXQ6Y6KK4SiyU6uBODcDcFE/edit?usp=sharing
- Web GUI URL: https://script.google.com/macros/s/AKfycbz2Vk-ikU8DSXjpnLq9r6HNAn3zlNAosvDoItG0cxy0bmItRDSVyEzTdwsL2HyFUz99/exec
- Google Apps Script: https://script.google.com/home/projects/1vHgXPTV_q8MC75FVzAEtzD2JPVnPBpMfFXbjZR7SLMVjoEH1FcjKlo8l/edit
最後附上其他日常生活應用:
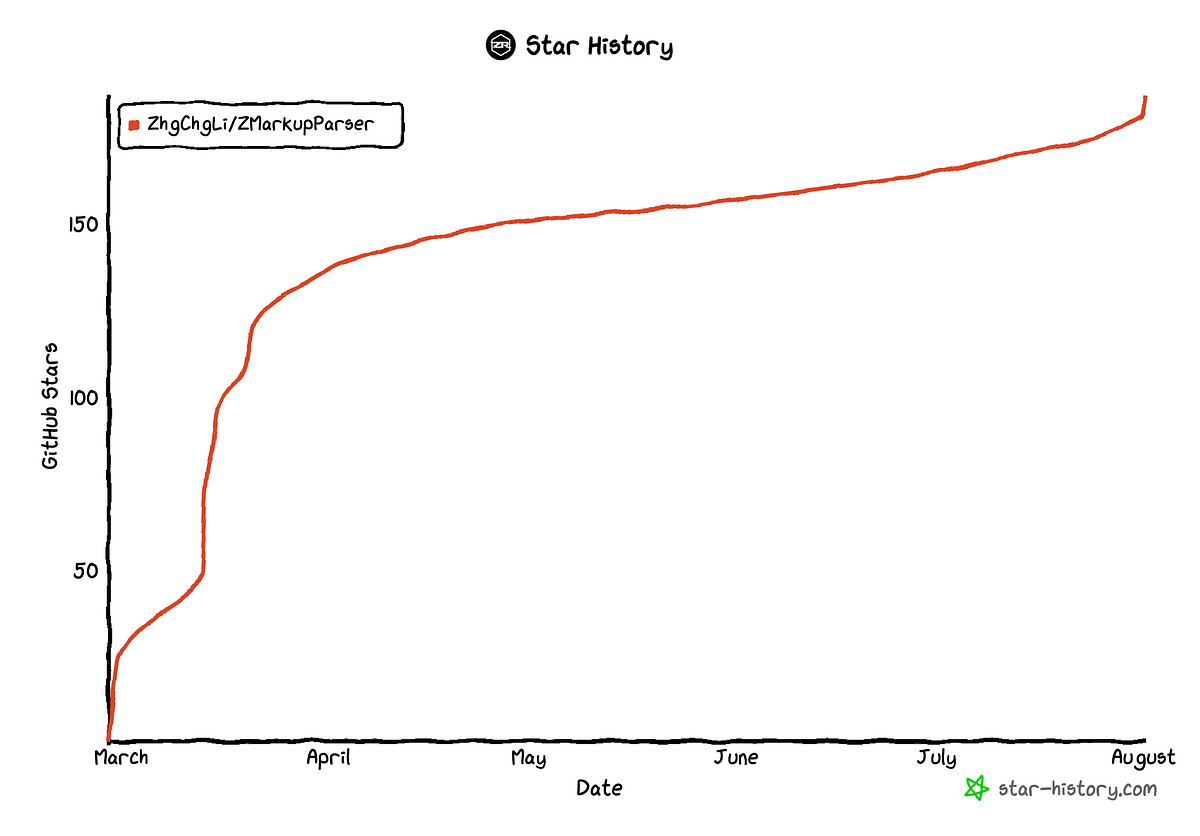
Robotic Process Automation with Google Apps Script — Github Repo Star Notifier to Line
Robotic Process Automation with Google Apps Script — Notion Database to Calendar
■■■■■■■■■■■■■■
ZhgChgLi @ Twitter Says:
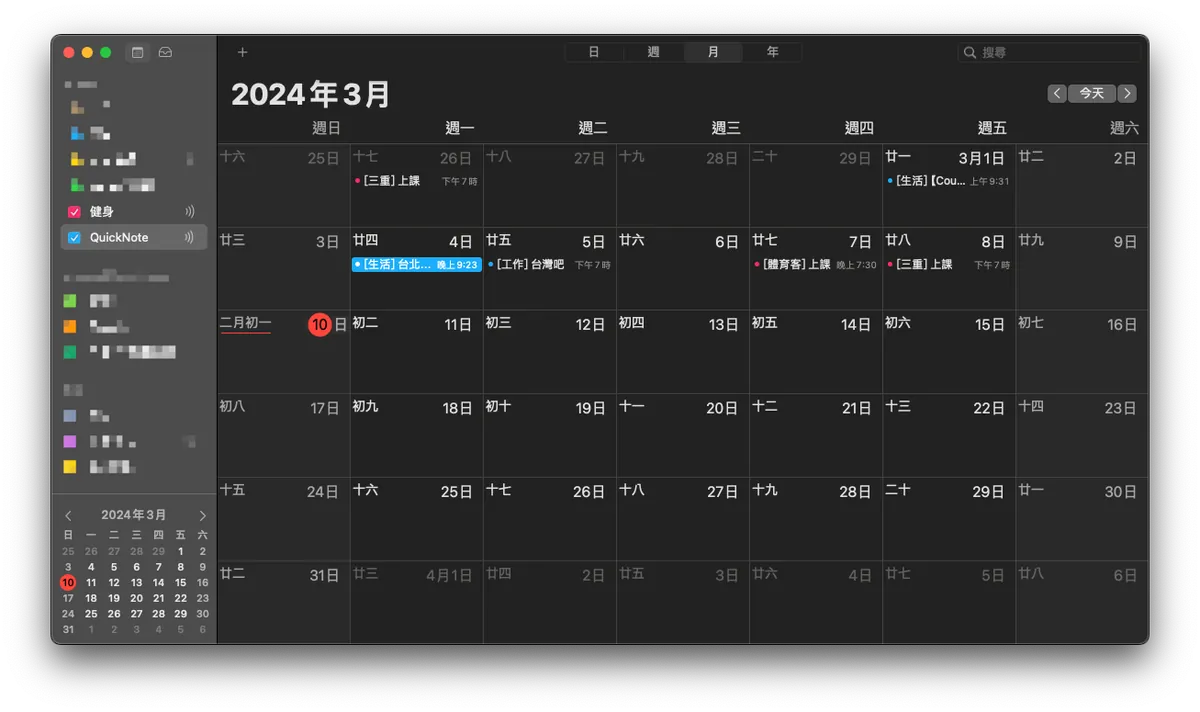
Notion Calendar 實在難用,無法取代 Apple 行事曆, 變成要看 Notion Calendar、Apple 兩個行事曆。
Notion 官方也不提供匯出 .ics 行事曆功能,只好用 Google Apps Script Web App + Notion API 自幹 .ics,統一都匯入 Apple 行事曆。
實作效果如圖,POC 原始碼如下: gist.github.com/zhgchgli0718/4… https://t.co/Lfd4AHLcHE
Tweeted at 2024-03-10 07:01:33.
■■■■■■■■■■■■■■
之前簡易實現的 Notion to Calendar 功能。
實現方式是,我去串接 Notion API 撈取 Database 資料並套用產出 ICS 格式網頁,部署成公開的網頁;將此網址新增到 Apple Calendar 即可。
Main.gs :
// Constant variables
const notionToken = "XXXXX";
const safeToken = "XXXXX";

function doGet(e) {
  const ics = HtmlService.createTemplateFromFile('ics');

  if (e.parameter.token != safeToken) {
    return ContentService.createTextOutput("Access Denied!");
  }

  ics.events = getQuickNote();

  return ContentService.createTextOutput(ics.evaluate().getContent()).setMimeType(ContentService.MimeType.ICAL);
}

function debug() {
  const ics = HtmlService.createTemplateFromFile('ics');
  ics.events = getQuickNote();
  Logger.log(ics.evaluate().getContent());
}

function getQuickNote() {
  // YOUR FILTER Condition:
  const payload = {
    "filter": {
      "and": [
        {
          "property": "Date",
            "date": {
            "is_not_empty": true
          }
        }
        ,
        {
          "property": "Name",
            "title": {
            "is_not_empty": true
          }
        }
      ]
    }
  };
  const result = getDatabase(YOUR_DATABASE_ID, payload);
  var events = [];
  for (const index in result.results) {
    const item = result.results[index]
    const properties = item.properties;

    const id = item['id'];
    const create = toICSDate(item["created_time"]);
    const edit = toICSDate(item["last_edited_time"]);
    const startDate = properties['Date']['date']['start'];
    const start = toICSDate(startDate);
    var endDate = properties['Date']?.['date']?.['end'];
    if (endDate == null) {
      endDate = startDate;
    }
    const end = toICSDate(endDate);
    const type = properties['Type']?.['multi_select']?.[0]?.['name'];

    const title = "["+type+"] "+properties?.['Name']?.['title']?.[0]?.['plain_text'];
    const description = item['url'];

    events.push(
      {
        "id":id,
        "create":create,
        "edit":edit,
        "start":start,
        "end":end,
        "title":title,
        "description":description
      }
    )
  }
  return events;
}
// TO UTC Date
function toICSDate(date) {
  const icsDate = new Date(date);
  icsDate.setHours(icsDate.getHours() - 8);
  return Utilities.formatDate(icsDate, "GMT+8", "yyyyMMdd'T'HHmmss'Z'");// 20240304T132300Z
}

// Notion
function getDatabase(id, payload) {
  const url = 'https://api.notion.com/v1/databases/'+id+'/query/';
  const options = {
    method: 'post',
    headers: {
      'Authorization': 'Bearer '+notionToken,
      'Content-Type': 'application/json',
      'Notion-Version': '2022-06-28'
    },
    payload: JSON.stringify(payload)
  };
  const result = UrlFetchApp.fetch(url, options);
  return JSON.parse(result.getContentText());
}
ics.html :
BEGIN:VCALENDAR
PRODID:-//Google Inc//Google Calendar 70.9054//EN
VERSION:2.0
CALSCALE:GREGORIAN
METHOD:PUBLISH
X-WR-CALNAME:NotionCalendar
X-WR-TIMEZONE:Asia/Taipei
BEGIN:VTIMEZONE
TZID:Asia/Taipei
X-LIC-LOCATION:Asia/Taipei
BEGIN:STANDARD
TZOFFSETFROM:+0800
TZOFFSETTO:+0800
TZNAME:CST
DTSTART:19700101T000000
END:STANDARD
END:VTIMEZONE
<?
  for(const eventIndex in events) {
    const event = events[eventIndex];
    ?>
BEGIN:VEVENT
DTSTART:<?=event["start"]?>

DTEND:<?=event["end"]?>

DTSTAMP:<?=event["edit"]?>

UID:<?=event["id"]?>

CREATED:<?=event["create"]?>

LAST-MODIFIED:<?=event["edit"]?>

SEQUENCE:0
STATUS:CONFIRMED
SUMMARY:<?=event["title"]?>

DESCRIPTION:<?=event["description"]?>

TRANSP:OPAQUE
END:VEVENT
<?
  }
?>
END:VCALENDAR
同前文,部署成網頁服務,點擊專案右上角「部署」->「新增部署作業」-> 左上角「選取類型」->「網頁應用程式」:
- 誰可以存取要選所有人,因為無法在加 Calendar 時進行 Google 登入驗證。

將網址新增至行事曆訂閱,完成 🎉🎉🎉🎉 !
工商時間
如果您與您的團隊有自動化工具、流程串接需求,不論是 Slack App 開發、Notion、Asana、Google Sheet、Google Form、GA 數據,各種串接需求,歡迎與我 聯絡開發 。


留言 · Comments