
Crashlytics + Google Analytics Automated Query for App Crash-Free Users Rate
Using Google Apps Script to Query Crashlytics via Google Analytics and Automatically Fill Data into Google Sheet

In the previous article “Crashlytics + Big Query: Building a More Real-Time and Convenient Crash Tracking Tool”, we exported Crashlytics crash records as raw data to Big Query and used Google Apps Script to schedule automatic queries for the Top 10 Crashes and post messages to a Slack Channel.
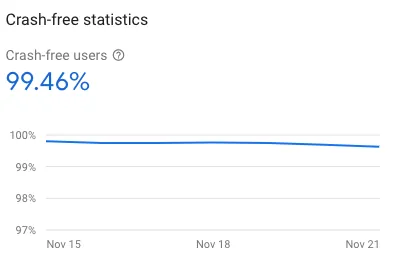
This article continues the automation of an important app crash-related metric — Crash-Free Users Rate, the percentage of unaffected users. Many app teams continuously track and record this data. Traditionally, this was done manually. The goal here is to automate this repetitive task and avoid errors from manual data entry. As mentioned before, Firebase Crashlytics does not provide any API for querying, so we need to connect Firebase data to other Google services and use their APIs to retrieve the relevant data.
At first, I thought this data could also be queried from Big Query; but this approach was completely wrong because Big Query contains raw crash data and does not include data for users without crashes, so it cannot calculate the Crash-Free Users Rate. There is little information online about this requirement, and after a long search, I found someone mentioning the keyword Google Analytics. I knew Firebase Analytics and Events could be linked to GA for querying, but I didn’t expect the Crash-Free Users Rate data to be included as well. After reviewing the GA API, Bingo!
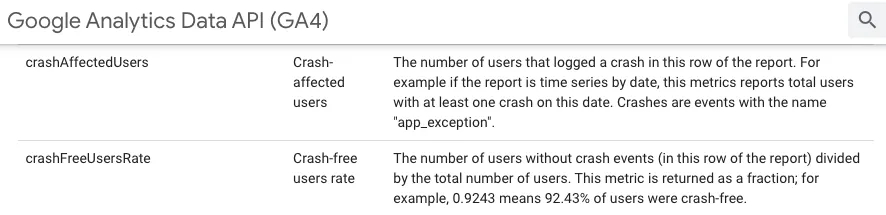
Google Analytics Data API (GA4) provides two metrics:
-
crashAffectedUsers: Number of users affected by crashes
-
crashFreeUsersRate: The percentage of users unaffected by crashes (expressed as a decimal)
Once you understand the workflow, you can start implementing it!
Connect Firebase -> Google Analytics
You can refer to the official guide for setup steps; they are omitted in this article.
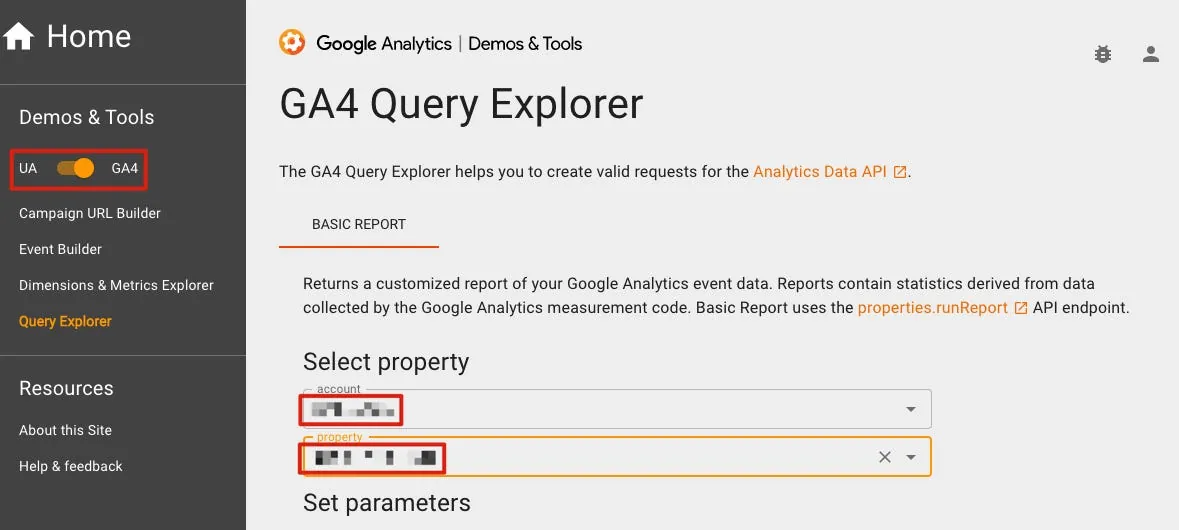
GA4 Query Explorer Tool
Before writing any code, we can first use the official Web GUI Tool to quickly build query conditions and get query results; after confirming the results are what we want, we can start coding.
-
Remember to select GA4 at the top left corner
-
After logging in on the right, select the corresponding GA Account & Property.
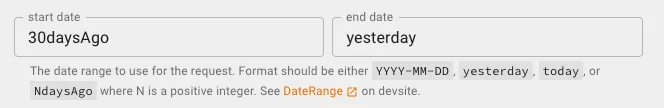
- Start Date, End Date: You can directly enter dates or use special variables to represent dates (
yesterday,today,30daysAgo,7daysAgo)
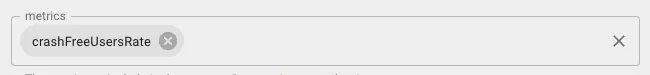
- metrics: Add
crashFreeUsersRate
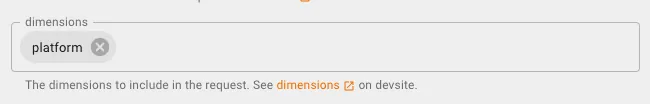
- dimensions: Add
platform(device type iOS/Android/Desktop…)
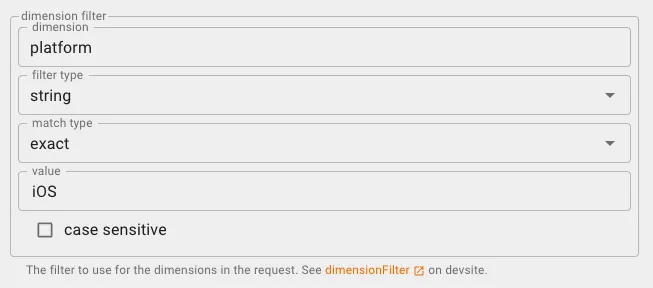
- dimension filter: add
platform,string,exact,iOSorAndroid
Query the Crash Free Users Rate separately for both platforms.
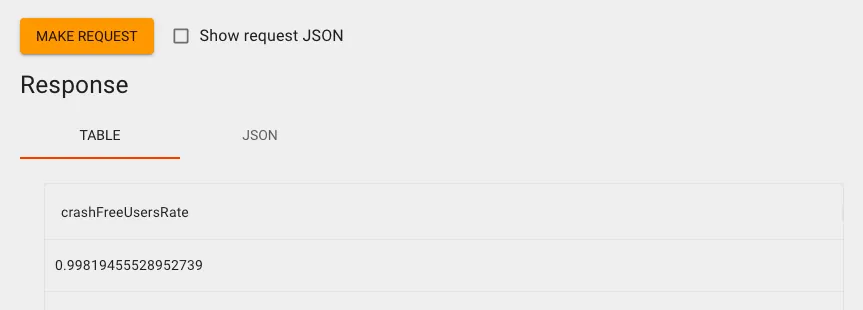
Scroll to the bottom and click “Make Request” to see the results. This will give us the Crash-Free Users Rate for the specified date range.
You can go back and open Firebase Crashlytics to compare if the data matches under the same conditions.
There may be slight differences between the two numbers here (we found a difference of 0.0002), the reason is unknown, but it is within an acceptable margin of error; if we consistently use GA Crash-Free Users Rate, then it can no longer be considered an error.
Automatically Insert Data into Google Sheet Using Google Apps Script
Next is the automation part. We will use Google Apps Script to query the GA Crash-Free Users Rate data and automatically fill it into our Google Sheet; achieving the goal of automatic entry and tracking.
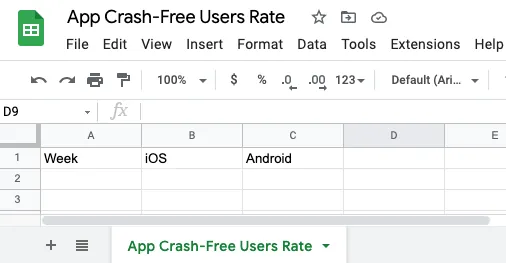
Assuming our Google Sheet is as shown in the above image.
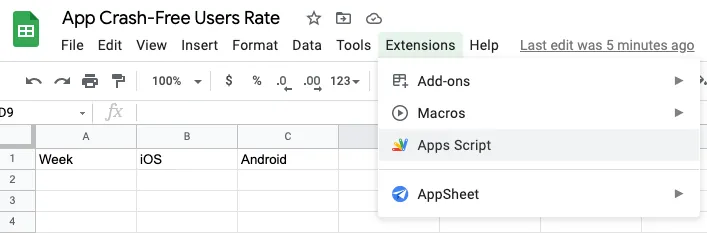
You can click Extensions -> Apps Script on the top of Google Sheet to create a Google Apps Script, or click here to visit Google Apps Script -> then click New Project on the top left.
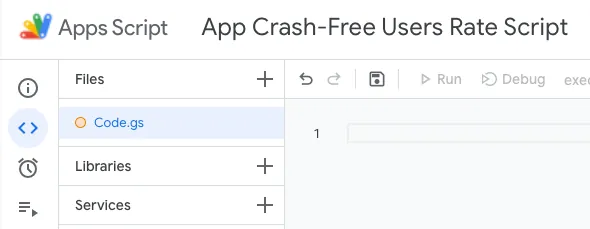
After entering, you can first click the untitled project name at the top and give the project a name.
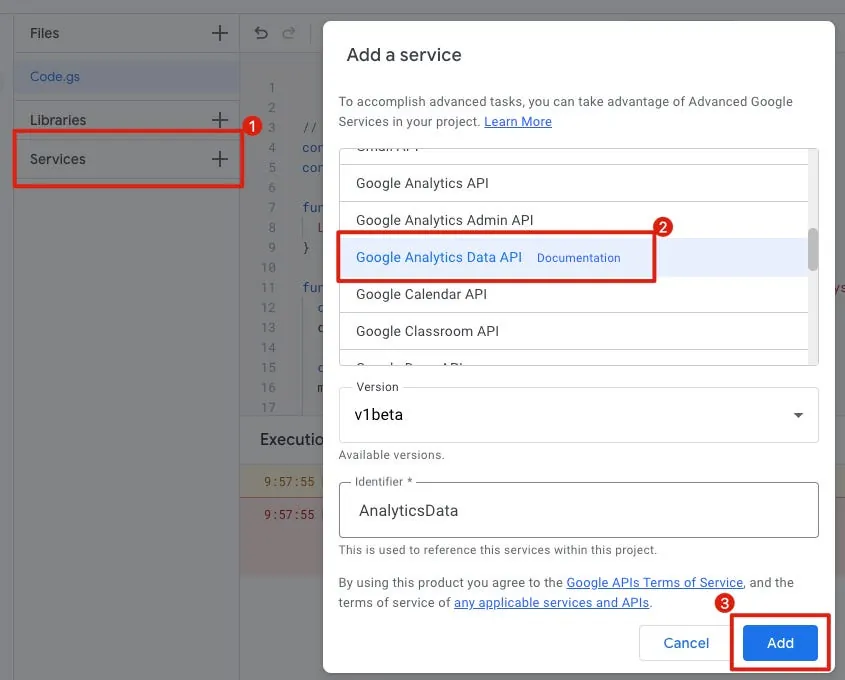
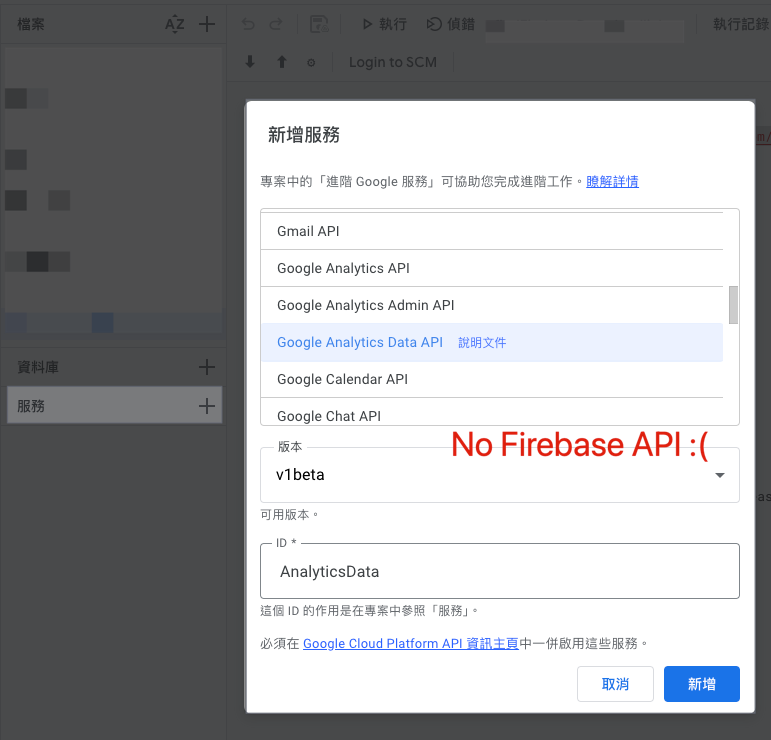
Click the “+” next to “Services” on the left and add “Google Analytics Data API”.
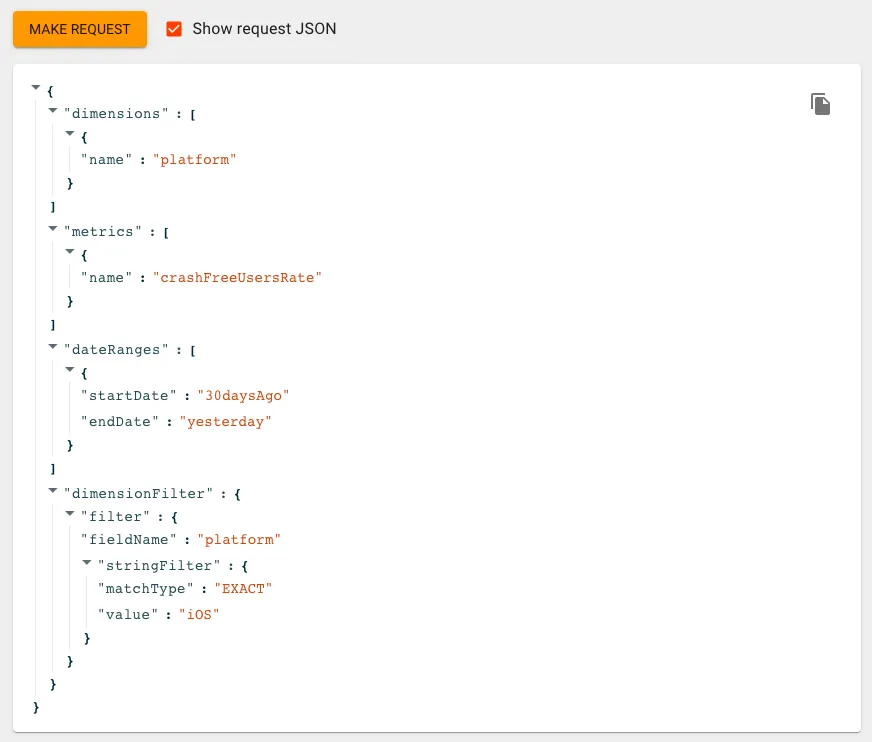
Go back to the GA4 Query Explorer tool. Next to the Make Request button, you can check “Show Request JSON” to get the Request JSON for this query.
After converting this Request JSON into Google Apps Script, it looks like this:
// Remember to add Google Analytics Data API to Services, or you'll see this error: ReferenceError: AnalyticsData is not defined
// https://ga-dev-tools.web.app/ga4/query-explorer/ -> property id
const propertyId = "";
// https://docs.google.com/spreadsheets/d/googleSheetID/
const googleSheetID = "";
// Google Sheet name
const googleSheetName = "App Crash-Free Users Rate";

function execute() {
  Logger.log(fetchCrashFreeUsersRate())
}

function fetchCrashFreeUsersRate(platform = "iOS", startDate = "30daysAgo", endDate = "today") {
  const dimensionPlatform = AnalyticsData.newDimension();
  dimensionPlatform.name = "platform";

  const metric = AnalyticsData.newMetric();
  metric.name = "crashFreeUsersRate";

  const dateRange = AnalyticsData.newDateRange();
  dateRange.startDate = startDate;
  dateRange.endDate = endDate;

  const filterExpression = AnalyticsData.newFilterExpression();
  const filter = AnalyticsData.newFilter();
  filter.fieldName = "platform";
  const stringFilter = AnalyticsData.newStringFilter()
  stringFilter.value = platform;
  stringFilter.matchType = "EXACT";
  filter.stringFilter = stringFilter;
  filterExpression.filter = filter;

  const request = AnalyticsData.newRunReportRequest();
  request.dimensions = [dimensionPlatform];
  request.metrics = [metric];
  request.dateRanges = dateRange;
  request.dimensionFilter = filterExpression;

  const report = AnalyticsData.Properties.runReport(request, "properties/" + propertyId);

  return parseFloat(report.rows[0].metricValues[0].value) * 100;
}
- GA Property ID: You can also get it from the previously mentioned GA4 Query Explorer tool:
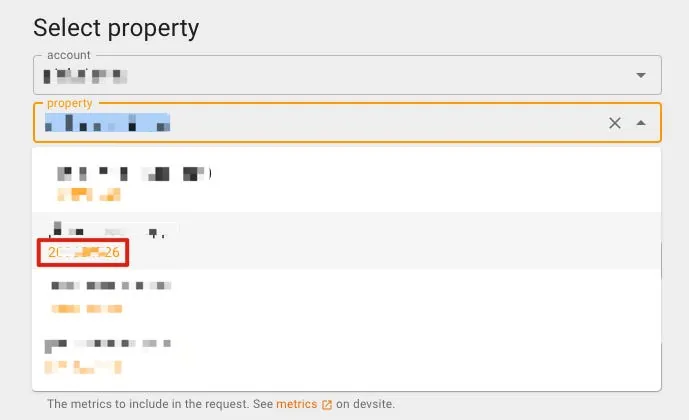
In the initial Property selection menu, the number below the chosen Property is the propertyId.
-
googleSheetID: You can get it from the Google Sheet URL https://docs.google.com/spreadsheets/d/
googleSheetID/edit -
googleSheetName: The name of the sheet in Google Sheet for crash records

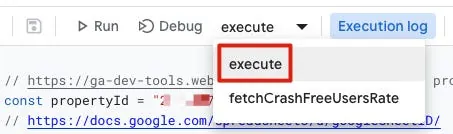
Paste the above code into the right-side code editor in Google Apps Script, then select the “execute” function from the dropdown menu at the top and click Debug to test if the data can be retrieved correctly:
The first time you run it, an authorization window will appear:
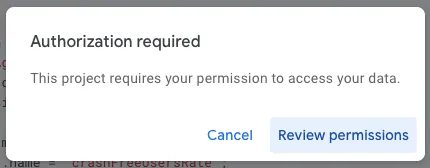
Complete the account authorization by following the steps.
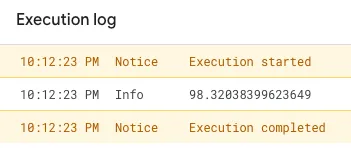
If executed successfully, the Crash-Free Users Rate will be printed in the log below, indicating a successful query.
Next, all we need to do is add automatic input into Google Sheet, and we’re all set!
Complete Code:
// Remember to add Google Analytics Data API to Services, or you'll see this error: ReferenceError: AnalyticsData is not defined

// https://ga-dev-tools.web.app/ga4/query-explorer/ -> property id
const propertyId = "";
// https://docs.google.com/spreadsheets/d/googleSheetID/
const googleSheetID = "";
// Google Sheet name
const googleSheetName = "";

function execute() {
  const today = new Date();
  const daysAgo7 = new Date(new Date().setDate(today.getDate() - 6)); // Today not included, so -6

  const spreadsheet = SpreadsheetApp.openById(googleSheetID);
  const sheet = spreadsheet.getSheetByName(googleSheetName);

  var rows = [];
  rows[0] = Utilities.formatDate(daysAgo7, "GMT+8", "MM/dd")+"~"+Utilities.formatDate(today, "GMT+8", "MM/dd");
  rows[1] = fetchCrashFreeUsersRate("iOS", Utilities.formatDate(daysAgo7, "GMT+8", "yyyy-MM-dd"), Utilities.formatDate(today, "GMT+8", "yyyy-MM-dd"));
  rows[2] = fetchCrashFreeUsersRate("android", Utilities.formatDate(daysAgo7, "GMT+8", "yyyy-MM-dd"), Utilities.formatDate(today, "GMT+8", "yyyy-MM-dd"));
  sheet.appendRow(rows);
}

function fetchCrashFreeUsersRate(platform = "iOS", startDate = "30daysAgo", endDate = "today") {
  const dimensionPlatform = AnalyticsData.newDimension();
  dimensionPlatform.name = "platform";

  const metric = AnalyticsData.newMetric();
  metric.name = "crashFreeUsersRate";

  const dateRange = AnalyticsData.newDateRange();
  dateRange.startDate = startDate;
  dateRange.endDate = endDate;

  const filterExpression = AnalyticsData.newFilterExpression();
  const filter = AnalyticsData.newFilter();
  filter.fieldName = "platform";
  const stringFilter = AnalyticsData.newStringFilter()
  stringFilter.value = platform;
  stringFilter.matchType = "EXACT";
  filter.stringFilter = stringFilter;
  filterExpression.filter = filter;

  const request = AnalyticsData.newRunReportRequest();
  request.dimensions = [dimensionPlatform];
  request.metrics = [metric];
  request.dateRanges = dateRange;
  request.dimensionFilter = filterExpression;

  const report = AnalyticsData.Properties.runReport(request, "properties/" + propertyId);

  return parseFloat(report.rows[0].metricValues[0].value) * 100;
}
Click the Run or Debug button above again to execute “execute”.
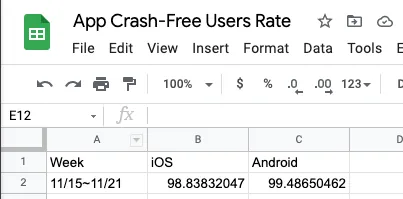
Back to Google Sheet, data added successfully!
Add Trigger to Schedule Automatic Execution
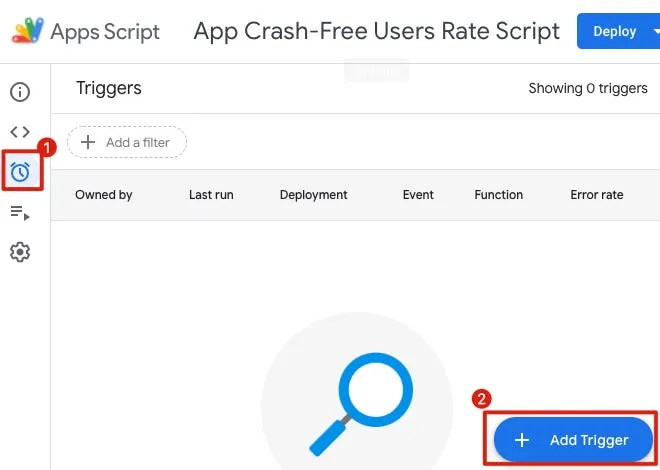
Select the clock icon on the left -> “+ Add Trigger” at the bottom right.
-
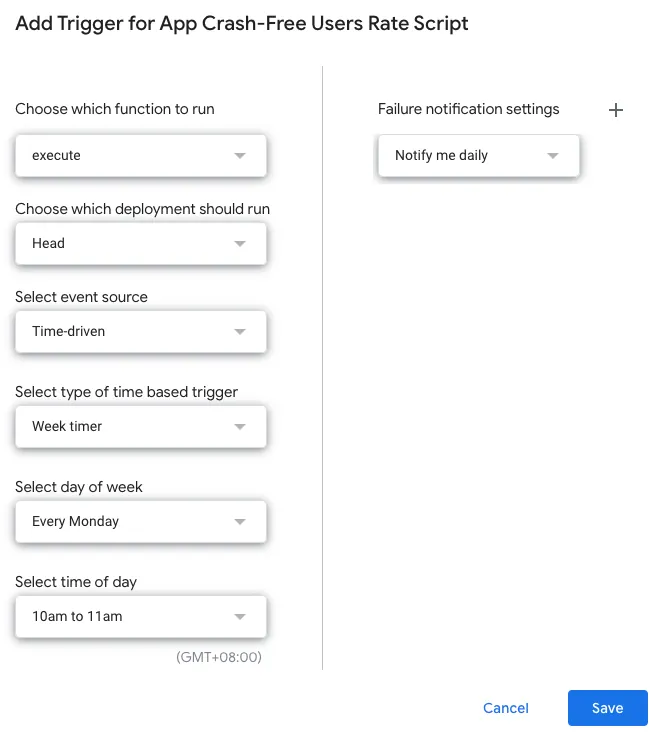
The first function to select is “execute”
-
The time-based trigger can select a weekly timer to track and add data once a week
After setting up, simply click Save.
Completed
Start fully automating the tracking of App Crash-Free Users Rate data; no manual queries or data entry needed; let the machine handle everything automatically!
We only need to focus on solving App Crash issues!
p.s. Unlike the previous article using Big Query which costs money to query data, this article’s method for querying Crash-Free Users Rate and using Google Apps Script is completely free and safe to use.
If you want to sync the results to a Slack Channel, you can refer to the previous article:
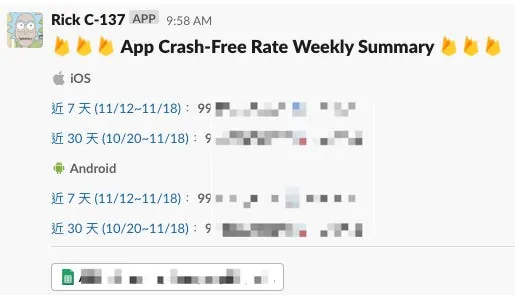
Further Reading
-
Ultimate Beginner’s Guide to Google Analytics 4 (NEW 2023 Interface) (Thanks to Emma for providing the information )
-
Crashlytics + Big Query to Create a More Real-Time and Convenient Crash Tracking Tool
-
Automate Routine Tasks with Python + Google Cloud Platform + Line Bot
-
Slack Builds a Fully Automated WFH Employee Health Status Reporting System

Comments