
Implementing Daily Data Report RPA Automation with Google Apps Script
Robotic Process Automation for Google Workspace Services Using Google Apps Script

Photo by Possessed Photography
Robotic Process Automation
RPA (Robotic Process Automation) translates to “Process Automation Robot” in Chinese. Looking back at human history, from hand gathering to the Stone Age and then to agricultural civilization, from the Industrial Revolution last century to the rise of information technology in the past 20 years, human work efficiency and productivity have grown exponentially. Along this journey, RPA applications have been everywhere: water wheels in agriculture (automating threshing), textile machines in the Industrial Revolution (automating weaving), factory robotic arms (automating assembly), and finally, the focus of this article—automating information-related tasks like automatic report queries and notifications.
To be honest, I only recently learned this term. Since my first job (7 years ago), I have been doing RPA tasks such as writing crawlers for data statistics, automating CI/CD processes, automating data queries, automating stability alerts, automating daily routine operations, and more. However, I used to call it simply “automation.” It’s time to give it a proper name — RPA (Robotic Process Automation).
Previous RPA work mostly focused on “writing code to automate a single task,” lacking full preliminary evaluation and analysis, use of No/Low Code tools, compliance, operation monitoring, actual data statistics, continuous improvement, and corporate culture promotion—all essential parts of complete RPA. However, as mentioned earlier, I only recently learned about this professional field, so please allow me to start with a practical implementation article first!
There are many platforms offering RPA services, such as Automation Anywhere, UiPath, Microsoft Power Automate, Blue Prism, as well as Zapier, IFTTT, Automate.io, and more.
You should choose the service that best fits your actual problem and platform needs.
A recommended free and open-source browser-based RPA tool: Automa .
Broadly speaking, transforming active dependencies between people or between people and tasks into dependencies on platforms by people or tasks is also a form of RPA.
For example: use Asana/Jira and other project management tools to uniformly manage tasks.
Based on the concept of shifting from active to passive, services that originally required manual checking for new notifications can also be automated with RPA to notify us automatically when there are updates.
For example: previously implemented Gmail to Slack forwards specific notification emails to the workgroup.
Benefits Evaluation of Robotic Process Automation
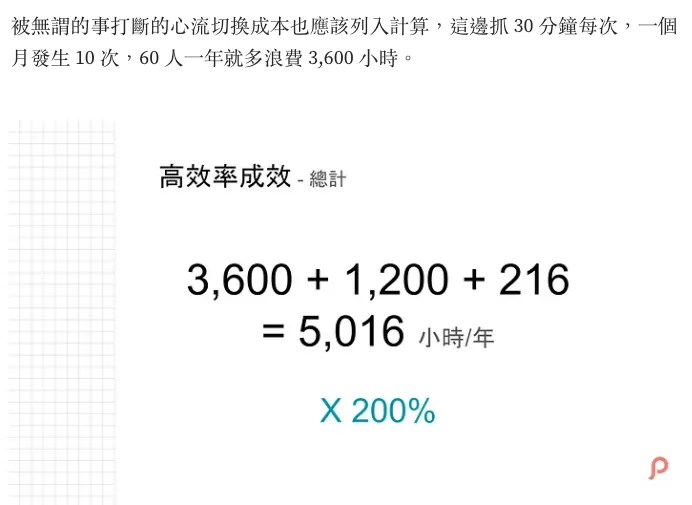
Previously, in the “2021 Pinkoi Tech Career Talk — Secrets of High-Efficiency Engineering Teams,” I shared about the cost of incremental tasks and flow interruptions; assuming a routine repetitive task takes 15 minutes each time and occurs 10 times a week, it wastes nearly 130 hours a year; if you also consider the cost of “flow switching,” the total waste could reach nearly 200 hours annually.
2021 Pinkoi Tech Career Talk — Secrets of High-Performance Engineering Teams
Flow switching means the time spent pausing from being fully focused and engaged on an important task to handle other matters, and then returning to re-enter that focused state after finishing them.
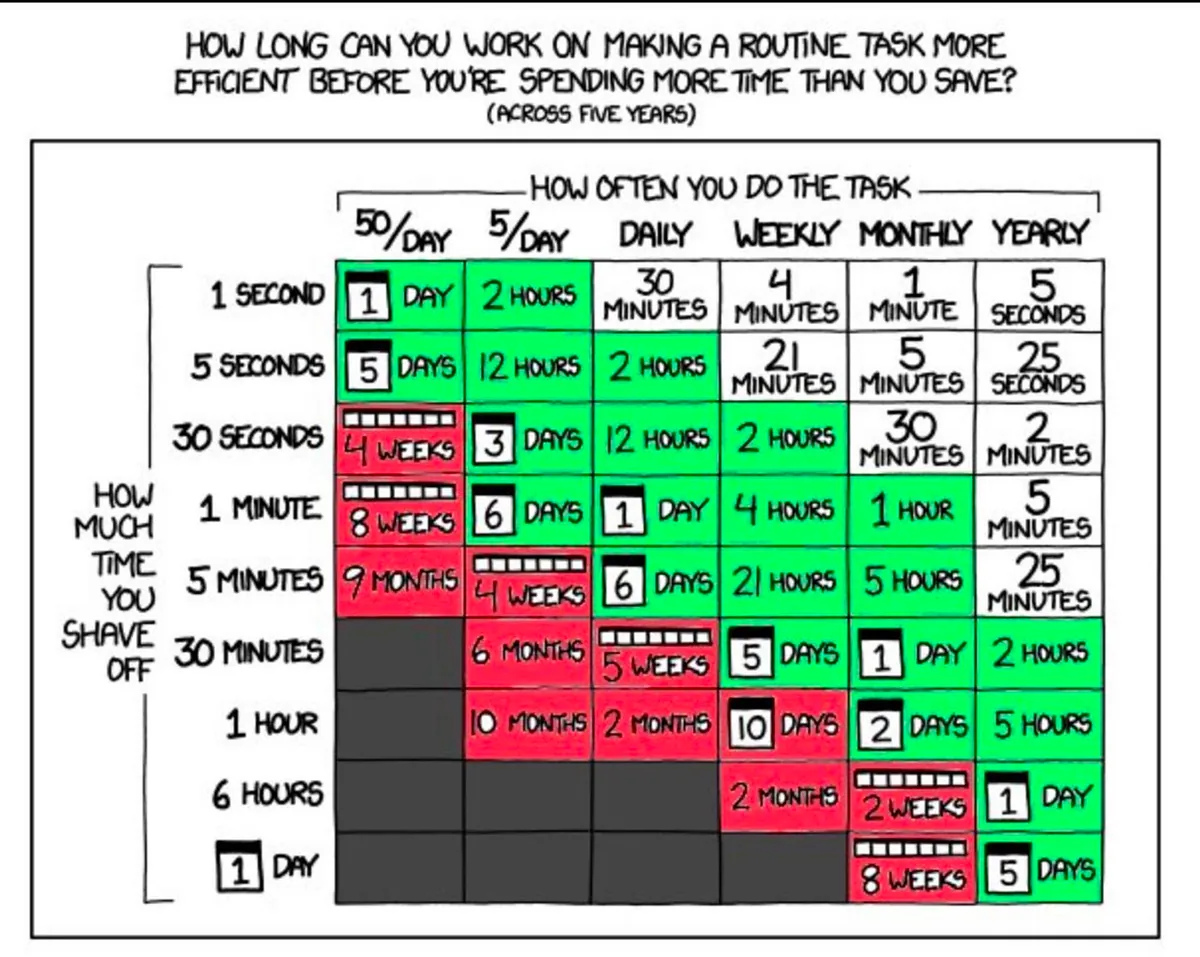
The benefits of developing RPA can be evaluated as shown in the figure below. As long as the development time and the frequency of occurrence exceed the time wasted, it is worth investing resources to implement it:
https://twitter.com/swyx/status/1196401158744502272
-
X-axis: Task occurrence frequency e.g., 50/Day (50 times per day)
-
Y-axis: How much manpower time is needed to complete each task
-
Time-consuming Range covers the past 5 years, with the middle of the table showing the labor cost wasted over these 5 years.
-
White indicates that the time cost of automation may exceed the benefits, making improvement not worthwhile.
-
Green indicates items worth automating
-
Red indicates a strong recommendation to automate.
Besides saving time, automated standardized processes can also reduce human errors and improve stability.
The Relationship Between Robotic Process Automation and AI
With the rise of AI, RPA is often mentioned; however, I believe RPA and AI are not directly related. RPA existed long before AI, and the benefits of implementing AI in enterprises may not surpass those of well-established RPA. RPA is more about corporate culture and work habits. Nonetheless, it’s undeniable that AI can help RPA reach the next level. For example, traditional RPA could only handle precise, routine tasks, but with AI, it can perform more ambiguous, dynamic, and intelligent decision-making tasks.
Robotic Process Automation at Google Workspace
Google Workspace (formerly G Suite) is our daily office collaboration partner. We use Gmail for email hosting, Google Docs for documents, Google Sheets for reports, Google Forms for surveys, and more. Automating the integration between these services or communication with internal and external systems requires implementing RPA.
However, Google does not provide a direct RPA service, but it can be achieved through the following services:
-
No Code: App Sheet (paid service) lets non-developers create service integrations and automation through a GUI.
-
Low Code: Google Apps Script (free service) enables quick and easy connection of Google services and external/internal systems with simple scripts.
-
Function as a Service: Cloud Functions (paid service with free tier) allows you to write full code and services, deploy, and run directly on Google Cloud.
No Code platform App Sheet I haven’t used, but I have quite some experience with Cloud Functions and Google Apps Script. Here are some personal experiences and choices from before:
Cloud Functions
-
Deployment Required
-
Supports multiple programming languages: Node.js, Python, Java, Go, PHP, Ruby…
-
Supports third-party package dependency management, installation, and usage
-
Supports full authentication mechanisms
-
Maximum execution time limit: 60 minutes
-
Pay as you go: Charges based on the number of executions, execution time, different processors, and memory used
-
Limited cold start issue (if not called for a long time, the first call will have a longer response time)
-
Cannot directly connect to Google services; must go through Auth/API verification
-
The free plan is as follows
Cloud Functions offers a permanent free tier for compute time resources, including allocation by GB-seconds and GHz-seconds. Besides 2 million invocations, this free tier provides 400,000 GB-seconds and 200,000 GHz-seconds of compute time, along with 5 GB of internet data transfer per month. The free tier usage is calculated based on the equivalent USD amount of the Level 1 pricing above. Regardless of whether the function runs in a Level 1 and/or Level 2 pricing region, the system allocates the same USD amount to you. However, when deducting free tier usage, the system uses the function execution region’s level (Level 1 or Level 2) as the basis.
Please note that even if you use the free tier, you must have a valid billing account.
In summary, Cloud Functions is recommended when you need more complete and complex RPA integrations or have extensive external API connection requirements.
Previous cases using Cloud Functions include:
I use it mainly when integrating with non-Google Workspace services and when bridging other external services is required.
Google Apps Script
-
Convenient, Simple, and Fast
-
Completely Free
-
Connecting services without complicated Auth authentication
(Google Apps Script directly uses the current executing account as the execution identity) -
Built-in Scheduling and Calendar Trigger Features
-
Using Google Apps Script to Make Network Requests
-
Only use Google Apps Script (based on JavaScript) for development
-
No support for package managers or version control features
-
Due to security reasons, customizing Request User-Agent information is not allowed
-
The execution time limit requires the script to complete within 6 minutes; otherwise, it will be terminated.
-
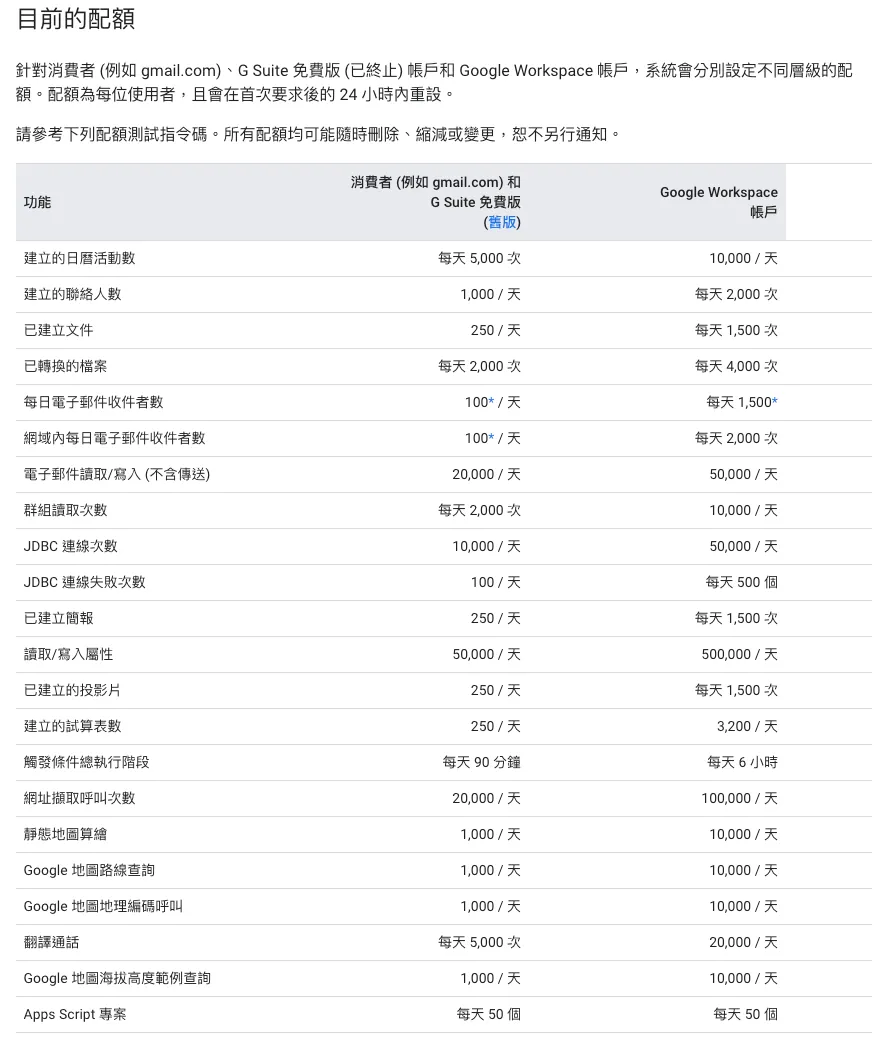
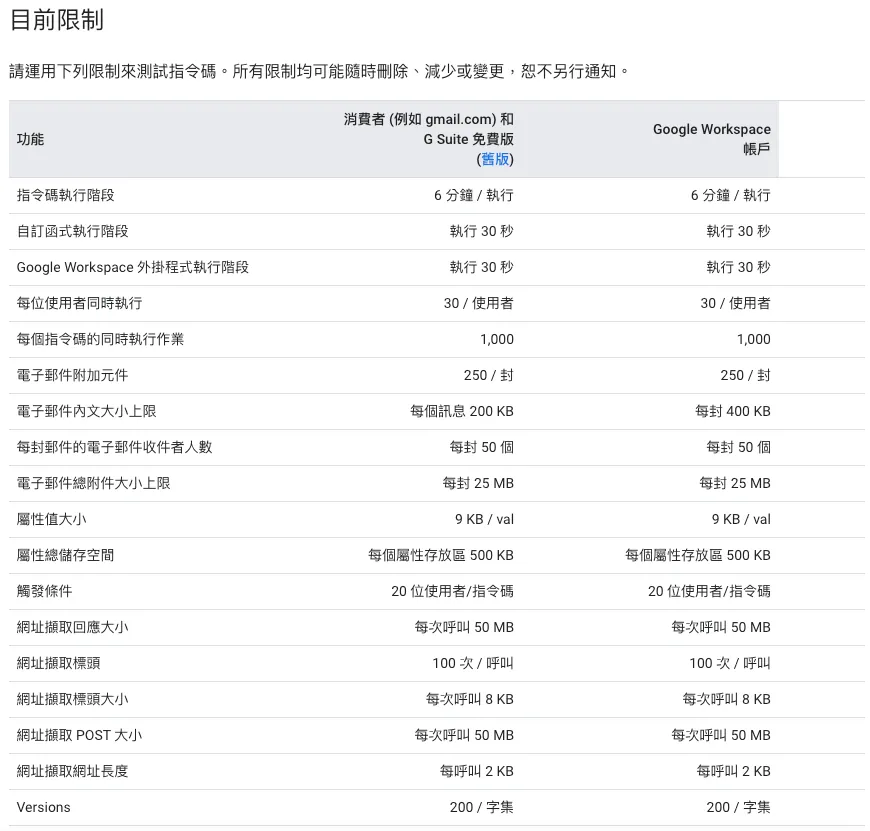
For other limits and quotas, please refer to the official GAS information:
Previous cases using Google Apps Script include:
Due to execution time and API request customization limits, I only use Google Apps Script for simple and quick tasks. For needs involving integration with Google services, I prioritize Google Apps Script (because using Cloud Functions requires implementing the full Google service authentication process).
Robotic Process Automation with Google Apps Script — Workday Report (Google Sheet x Google Analytics)
Finally, we arrive at the main topic of this article: implementing Google service RPA automation using Google Apps Script.
Background
The product team needs to check Google Analytics data daily and fill it into a Google Sheet report for trend analysis; the daily data is also published on a Dashboard screen for all members to stay updated.
Colleagues spend about 30 minutes every day upon arriving at the office to complete this task; if they have other matters to handle, they must wait until this routine work is finished or delay publishing the daily data report.
A Simple Estimation of RPA Benefits:
-
Annual time spent:
1 person x 30 mins x 365 days (including holidays) = 182 hours -
Automation Cost:
In this case, it takes about 1 person x 5 days = 40 hours
Therefore, we only need to invest one week of development time to handle the workload of colleagues responsible for data checking in the long run, allowing them to focus on more important tasks.
Goal
Our goal is to use Google Apps Script to build an RPA that automatically fetches daily data from Google Analytics and internal system report APIs, fills it into Google Sheets, and sets up a Web UI Dashboard.
Final Result
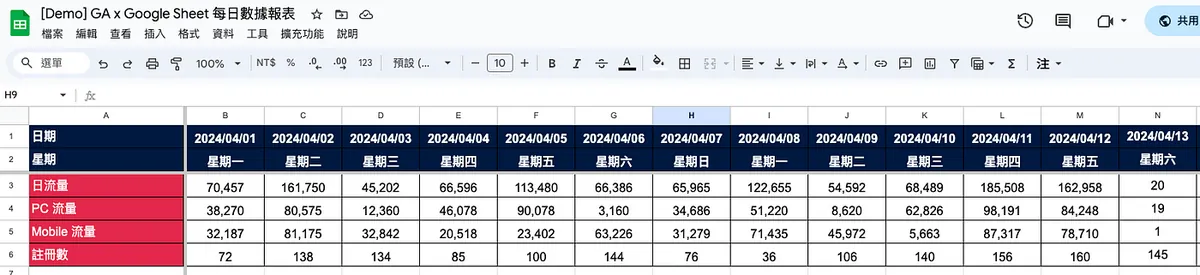
- Google Sheet:
https://docs.google.com/spreadsheets/d/1-9lZCpsu3E7eDmO-lMkXJXQ6Y6KK4SiyU6uBODcDcFE/edit?usp=sharing
- Web GUI URL:
https://script.google.com/macros/s/AKfycbz2Vk-ikU8DSXjpnLq9r6HNAn3zlNAosvDoItG0cxy0bmItRDSVyEzTdwsL2HyFUz99/exec
The data is fake and for demo purposes only; starting from 2024/04/13, it will be especially low or remain at 0 because my zhgchg.li GA truly has “0” traffic Q_Q.
Tasks to Complete
-
Creating Google Apps Script and Getting Familiar with the Editor
-
Get/Create the Sheet for the Corresponding Date
-
Connect to Google Analytics to Fetch Data
-
Filling Data
-
Set up a schedule to run automatically every day
Disclaimer
Due to the article’s explanation needs, the following code minimizes abstraction to increase clarity. You can modify it according to your actual requirements.
At the end of the article, a complete public Google Sheet & Google Apps Script are provided. If you don’t want to follow the steps one by one, you can directly modify the template attached at the end.
Step 1. Create Google Apps Script
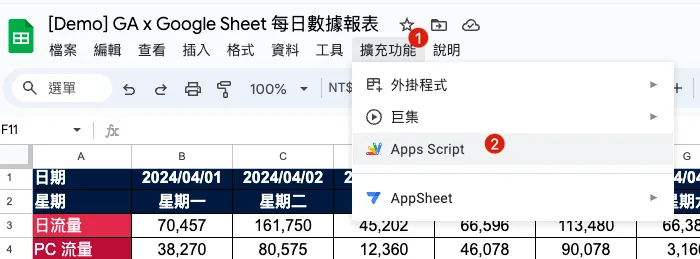
Simply select “Extensions” -> “Apps Script” on the report where you want to implement automation to automatically create a Google Apps Script linked to the Google Sheet report.
You can also create a Google Apps Script directly from the Google Apps Script homepage, but this will not link it to a Google Sheet.
It is not necessary to link in order to operate the corresponding Google Sheet. Both creation methods are possible. The difference lies in who owns the Script: if it links to a report, the report owner owns it; if created by yourself, the creator owns it. Ownership matters because if the account is deactivated due to resignation, the script may stop working or be deleted.
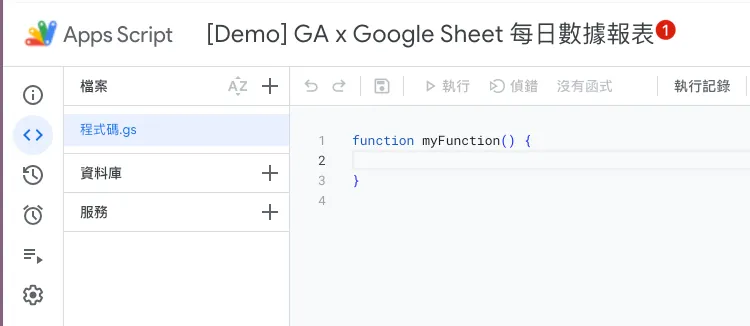
After creating the script, we can first rename our script project from the top.
Google Apps Script Basics
Before moving on to the next step of writing the code, let’s first cover some basic knowledge of Google Apps Script.
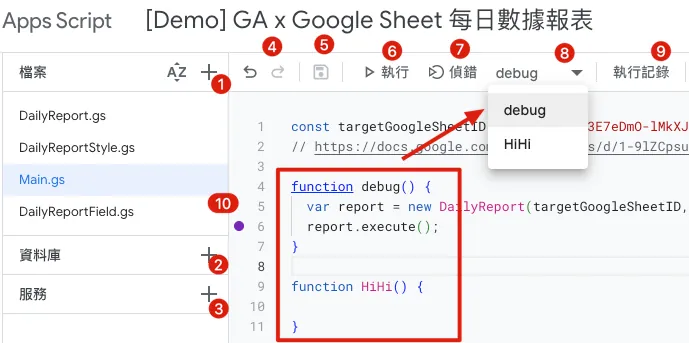
About the Editor
By default, Google service SDKs are imported (can be called without special import):
-
CalendarApp Calendar
-
DocumentApp Google Drive
-
FormApp Google Form
-
SpreadsheetApp Google Sheet
-
GmailApp Gmail
-
Files:
You can add multiple .gs files to store different object codes for better organization; all files run under the same namespace and lifecycle, so be careful as duplicate object or variable names may overwrite each other.
Besides .gs script files, you can also add .html HTML Template files for rendering Web UI. (This will be introduced later) -
Database:
We can use libraries (a.k.a. Lib) written by others by importing their Script ID. Of course, we can also deploy our own code as a library for others to use.
There are also some powerful tools packaged by experts available, but the downside is that you can only find Script IDs through Google search, as there is no official database list for reference.
e.g. HTML Parser Tool Cheer.io Script ID:1ReeQ6WO8kKNxoaA_O0XEQ589cIrRvEBA9qcWpNqdOP17i47u6N9M5Xh0 -
Service:
Google service SDKs that are not included by default can be added here for use.
e.g. Google Analytics Data -
Restore, Next Steps
-
Save or Control + s
-
Run or Control + r
If an error occurs, it will be shown directly in the Console and the script will stop. -
Debugging
When the execution reaches a breakpoint (10), it will pause and open the Debug View on the right. You can then continue execution.
If an error occurs, the execution will pause and open the Debug View on the right. -
Debugging and Running Target Method (Function Name)
Only methods belonging to the currently selected file can be chosen. -
View Editor Execution Logs
One more thing about formatting: in some browsers, pressing “Control + [” to indent may trigger the back action to the previous page, so be careful!
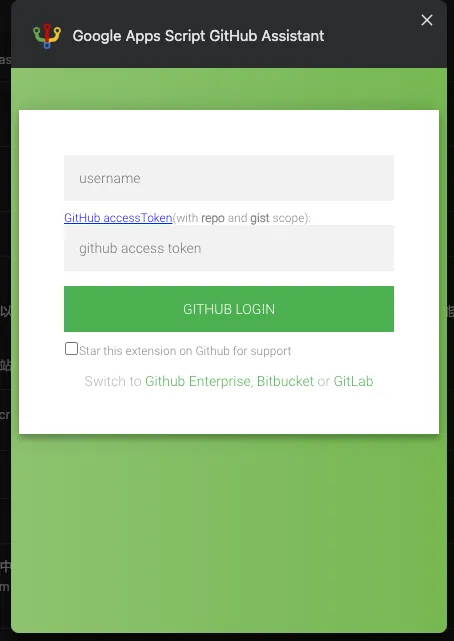
Google Apps Script GitHub Assistant Chrome Extension Version Control Plugin
- It is recommended to install this Extension to connect Google Apps Script with git, enabling version control to prevent accidental loss of work.
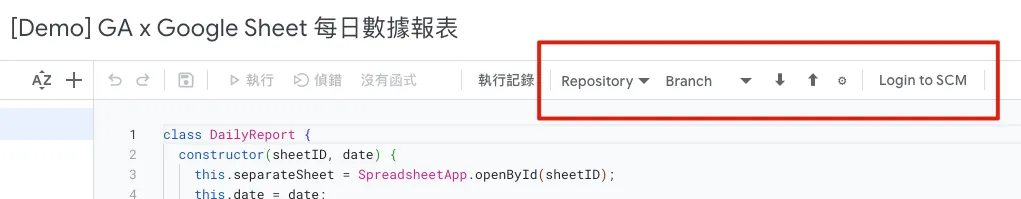
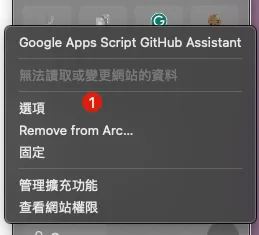
- If you encounter a Push/Pull Error or clicking has no response, please first follow the steps above: “Options” -> Connect to Github or re-verify Google authorization.
Logger Message
You can use the following script with Debug to print debug logs in the Console below.
Logger.log("Hi")
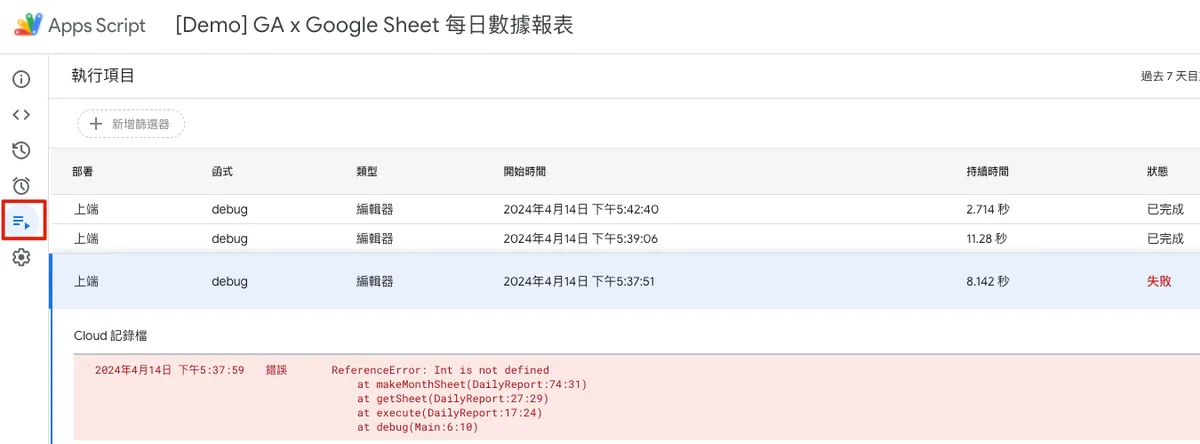
Execution Logs and Error Information
When running in the editor, logs or errors will be displayed directly. To check execution records or errors that occur during automatic runs, go to the “Executions” tab.
Automatic Trigger
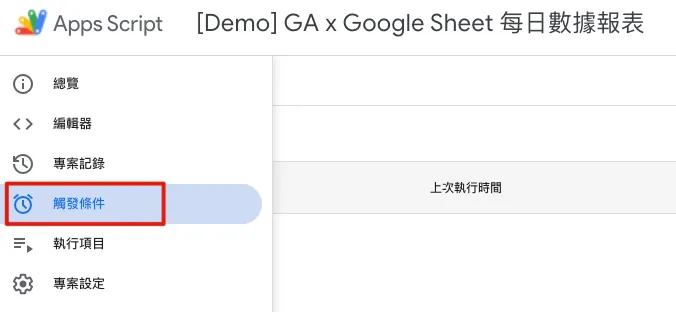
The “Triggers” tab allows you to set how functions in the script are automatically triggered. The available trigger options include:
-
Run when Google Sheet is: opened, edited, content changed, or form submitted
-
Scheduled trigger cycle: execute once every X minutes, X hours, X days, X weeks, or X months
-
Trigger on specific date: Execute at YYYY-MM-DD HH:MM
-
When Calendar: On Update Trigger
Error notification settings allow you to configure how you are notified when the script encounters an error.
Grant Execution Authorization Identity
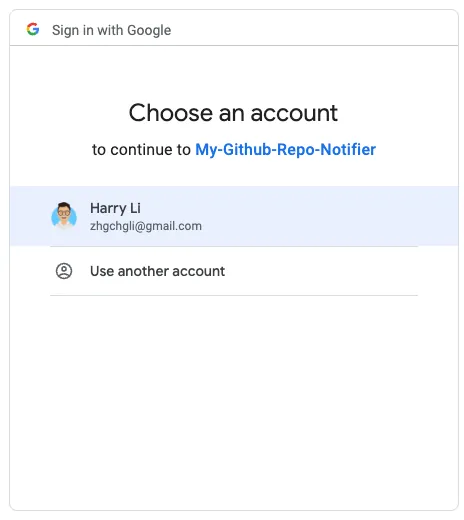
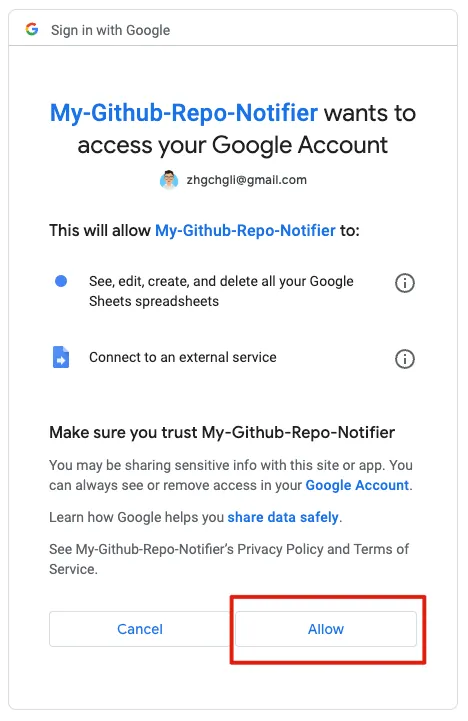
The first time you run/deploy or add new services/resources, you need to reauthorize. After authorization, all executions will run under your authorized identity, so make sure the account you authorize (usually the current one) has the necessary permissions for those resources or services (e.g., access to the specific Google Sheet).
After the account selection pop-up appears, choose the account to authorize execution (usually the current Google Apps Script account):
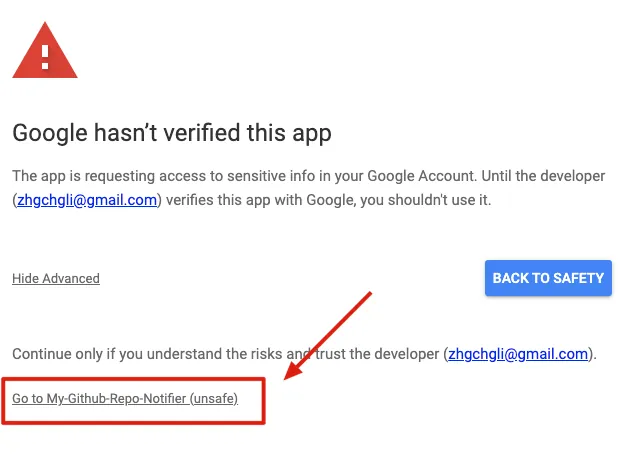
The message “Google hasn’t verified this app” appears because the app we are developing is for personal use only and does not require Google verification.
Simply click “Advanced” -> “Go to XXX (unsafe)” -> “Allow”:

After completing the authorization, the script can run successfully. If no resources are changed, re-authorization is not required.
2. Get/Create the Sheet for the Corresponding Date
After understanding the basics, we can start writing the code for the first feature.
We create the following multiple files to conveniently store different objects.
DailyReportStyle.gs field style object:
class HeaderStyle {
  constructor() {
    this.color = "#ffffff";
    this.backgroundColor = "#e3284b";
    this.bold = false;
    this.size = 12;
    this.horizontalAlignment = "center";
    this.verticalAlignment = "middle";
  }
}

class ContentStyle {
  constructor() {
    this.color = "#000000";
    this.backgroundColor = "#ffffff";
    this.bold = false;
    this.size = 12;
    this.horizontalAlignment = "center";
    this.verticalAlignment = "middle";
  }
}

class HeaderDateStyle {
  constructor() {
    this.color = "#ffffff";
    this.backgroundColor = "#001a40";
    this.bold = true;
    this.size = 12;
    this.horizontalAlignment = "center";
    this.verticalAlignment = "middle";
  }
}
DailyReportField.gs field data object:
class DailyReportField {
  constructor(name, headerStyle, contentStyle, format = null, value = null) {
    this.name = name;
    this.headerStyle = headerStyle;
    this.contentStyle = contentStyle;
    this.format = format;
    this.value = value;
  }
}
DailyReport.gs Main Script Logic for the Report:
class DailyReport {
  constructor(sheetID, date) {
    this.separateSheet = SpreadsheetApp.openById(sheetID);
    this.date = date;

    this.sheetFields = [
      new DailyReportField("Date", new HeaderDateStyle(), new HeaderDateStyle()),
      new DailyReportField("Day of Week", new HeaderDateStyle(), new HeaderDateStyle()),
      new DailyReportField("Daily Traffic", new HeaderStyle(), new ContentStyle(), "#,##0", '=INDIRECT(SUBSTITUTE(ADDRESS(1,COLUMN(),4),"1","")&4)+INDIRECT(SUBSTITUTE(ADDRESS(1,COLUMN(),4),"1","")&5)'), // =4(PC Traffic) + 5(Mobile Traffic)
      new DailyReportField("PC Traffic", new HeaderStyle(), new ContentStyle(), "#,##0"),
      new DailyReportField("Mobile Traffic", new HeaderStyle(), new ContentStyle(), "#,##0"),
      new DailyReportField("Registrations", new HeaderStyle(), new ContentStyle(), "#,##0")
    ]

    // Explanation of daily traffic formula:
    // 1. The COLUMN() function returns the current cell's column number.
    // 2. ADDRESS(1, COLUMN(), 4) generates a relative cell address with the given row (1) and the current column number. The third parameter 4 means no dollar signs ($) for absolute references. For example, in column C, it returns "C1".
    // 3. SUBSTITUTE(ADDRESS(1, COLUMN(), 4), "1", "") removes the number 1 from the address, leaving only the column letter, e.g., "C".
    // 4. INDIRECT(SUBSTITUTE(ADDRESS(1, COLUMN(), 4), "1", "") & 4) concatenates "4" to the column letter, forming "C4", then INDIRECT converts this string to a cell reference. So in column C, it references cell C4.
    // 5. Similarly, INDIRECT(SUBSTITUTE(ADDRESS(1, COLUMN(), 4), "1", "") & 5) references the cell in the same column but row 5, e.g., C5.
    // 6. Finally, the values of these two INDIRECT references are added together.
  }

  execute() {
    const sheet = this.getSheet();

  }

  // Get the target sheet for the given date
  getSheet() {
    // Use month to differentiate sheets, find the sheet for the current month
    var thisMonthSheet = this.separateSheet.getSheetByName(this.getSheetName());
    if (thisMonthSheet == null) {
      // If not found, create a new monthly sheet
      thisMonthSheet = this.makeMonthSheet();
    }

    return thisMonthSheet;
  }

  // Naming rule for monthly sheets
  getSheetName() {
    return Utilities.formatDate(this.date, "GMT+8", "yyyy-MM");
  }

  // Create a new monthly sheet
  makeMonthSheet() {
    // Add a new sheet for the month, move it to the first position
    var thisMonthSheet = this.separateSheet.insertSheet(this.getSheetName(), {index: 0});
    thisMonthSheet.activate();
    this.separateSheet.moveActiveSheet(1);

    // Insert the first column, set field names, freeze, width 200
    thisMonthSheet.insertColumnsBefore(1, 1);
    thisMonthSheet.setFrozenColumns(1);
    thisMonthSheet.setColumnWidths(1, 1, 200);

    // Fill in field names
    for(const currentRow in this.sheetFields) {
      const sheetField = this.sheetFields[currentRow];
      const text = sheetField.name;
      const style = sheetField.headerStyle;

      const range = thisMonthSheet.getRange(parseInt(currentRow) + 1, 1);
      this.setContent(range, text, style);
      range.setHorizontalAlignment("left");
    }

    // Set row heights
    thisMonthSheet.setRowHeights(1, Object.keys(this.sheetFields).length, 30);

    // Freeze first and second rows (Date, Day of Week)
    thisMonthSheet.setFrozenRows(2);

    // Add total column
    thisMonthSheet.insertColumnsAfter(thisMonthSheet.getLastColumn(), 1); // Add one column after last
    const summaryColumnIndex = thisMonthSheet.getLastColumn() + 1;

    // Fill total column
    for(const currentRow in this.sheetFields) {
      const sheetField = this.sheetFields[currentRow];
      const summaryRowIndex = parseInt(currentRow) + 1;

      const range = thisMonthSheet.getRange(summaryRowIndex, summaryColumnIndex);
      const style = sheetField.contentStyle;

      if (summaryRowIndex == 1) {
        // Date...
        this.setContent(range, "Total", style);
      } else if (summaryRowIndex == 2) {
        // Day of Week... merge...
        const mergeRange = thisMonthSheet.getRange(1, summaryColumnIndex, summaryRowIndex, 1);
        this.setContent(mergeRange, "Total", style);
        mergeRange.merge();
      } else {
        this.setContent(range, '=IFERROR(SUM(INDIRECT(SUBSTITUTE(ADDRESS(1, 1, 4), "1", "") & '+summaryRowIndex+'):INDIRECT(SUBSTITUTE(ADDRESS(1, COLUMN() - 1, 4), "1", "") & '+summaryRowIndex+')), 0)', style);

        // 1. IFERROR(value, [value_if_error]) checks for errors in the formula and returns the specified value if an error occurs. It takes two parameters: `value` is the expression to evaluate, `value_if_error` is the return value on error. Here, it returns 0 if SUM causes an error.
        // 2. SUM(range) calculates the total of numbers in the range.
        // 3. INDIRECT(ref_text, [is_A1_notation]) converts a text string to a cell reference. Used here to dynamically generate the reference range.
        // 4. SUBSTITUTE(text, old_text, new_text, [instance_num]) replaces specified text in a string. Used here to remove "1" from the ADDRESS function output.
        // 5. ADDRESS(row, column, [abs_num], [a1], [sheet]) returns the cell address for given row and column. ADDRESS(1, 1, 4) returns the address for row 1, column 1 without $ signs. Similarly, ADDRESS(1, COLUMN() - 1, 4) returns the address for the first row and previous column.
        // 6. COLUMN() returns the current cell's column number.
        // 7. summaryRowIndex = current row number
      }
    }

    return thisMonthSheet;
  }

  setContent(range, text, style) {
    if (String(text) != "") {
      range.setValue(text);
    }

    range.setBackgroundColor(style.backgroundColor);
    range.setFontColor(style.color);

    if (style.bold) {
      range.setFontWeight("bold");
    }

    range.setHorizontalAlignment(style.horizontalAlignment);
    range.setVerticalAlignment(style.verticalAlignment);
    range.setFontSize(style.size);
    range.setBorder(true, true, true, true, true, true, "black", SpreadsheetApp.BorderStyle.SOLID);
  }
}
Main.gs as the main program entry point:
const targetGoogleSheetID = "1-9lZCpsu3E7eDmO-lMkXJXQ6Y6KK4SiyU6uBODcDcFE"
// https://docs.google.com/spreadsheets/d/1-9lZCpsu3E7eDmO-lMkXJXQ6Y6KK4SiyU6uBODcDcFE/edit#gid=275710641

function debug() {
  var report = new DailyReport(targetGoogleSheetID, new Date());
  report.execute();
}
After finishing, go back to Main.gs, select “debug,” and click to start debugging. Check if the execution results are correct and if there are any errors.
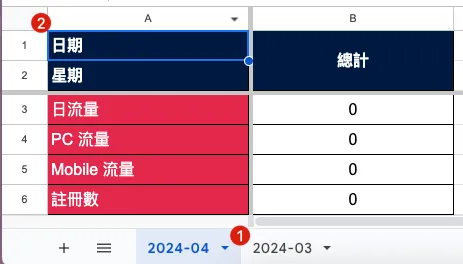
After running successfully, it will return to the report showing the current new month with default columns and total columns filled in. If it already exists, there will be no response.
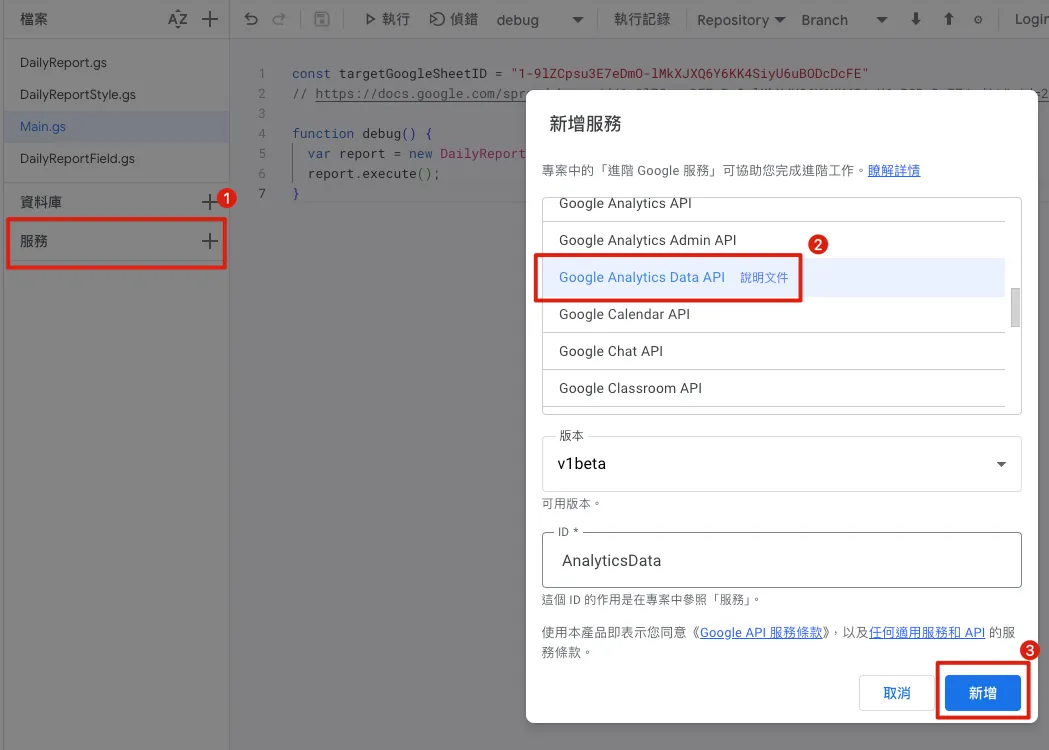
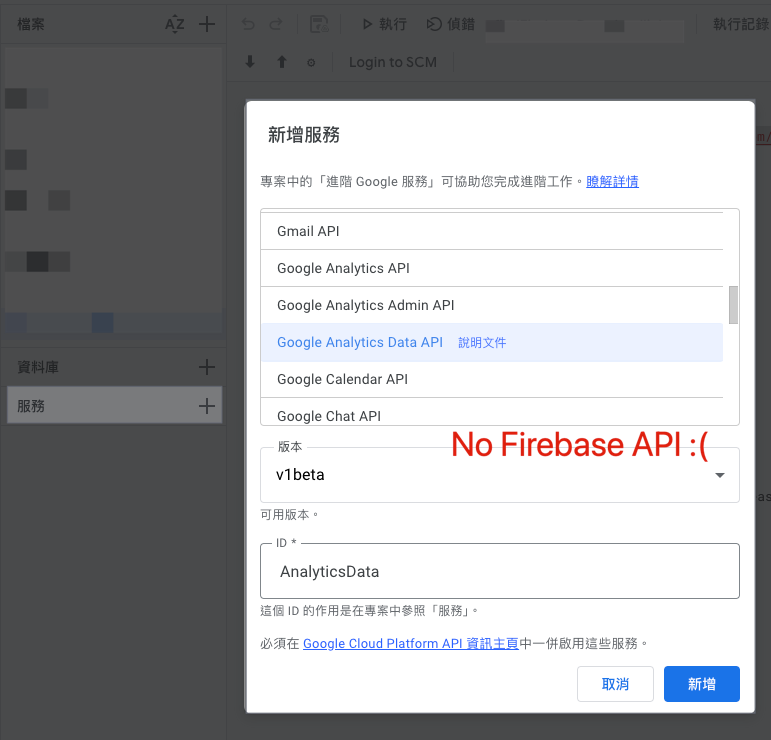
3. Connect to Google Analytics to Fetch Data
First, you need to add the “AnalyticsData” service:
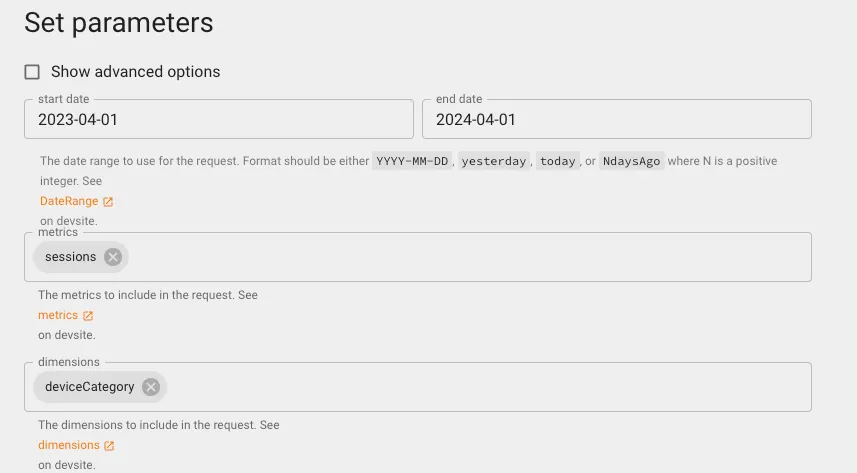
Build Query Conditions Using GA4 Debug Tool:
-
Can be built by referring to GA 4 backend filter conditions
-
This article uses querying the number of Sessions as an example, distinguishing by device Grouping
After logging in and authorizing, select the target resource:
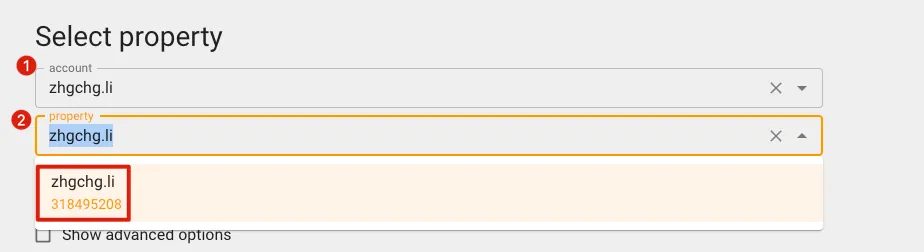
Note down the number shown under the property; this is the GA Property ID you need to query.
Set query parameters and filter conditions:
Click “Make Request” to get the Response result:
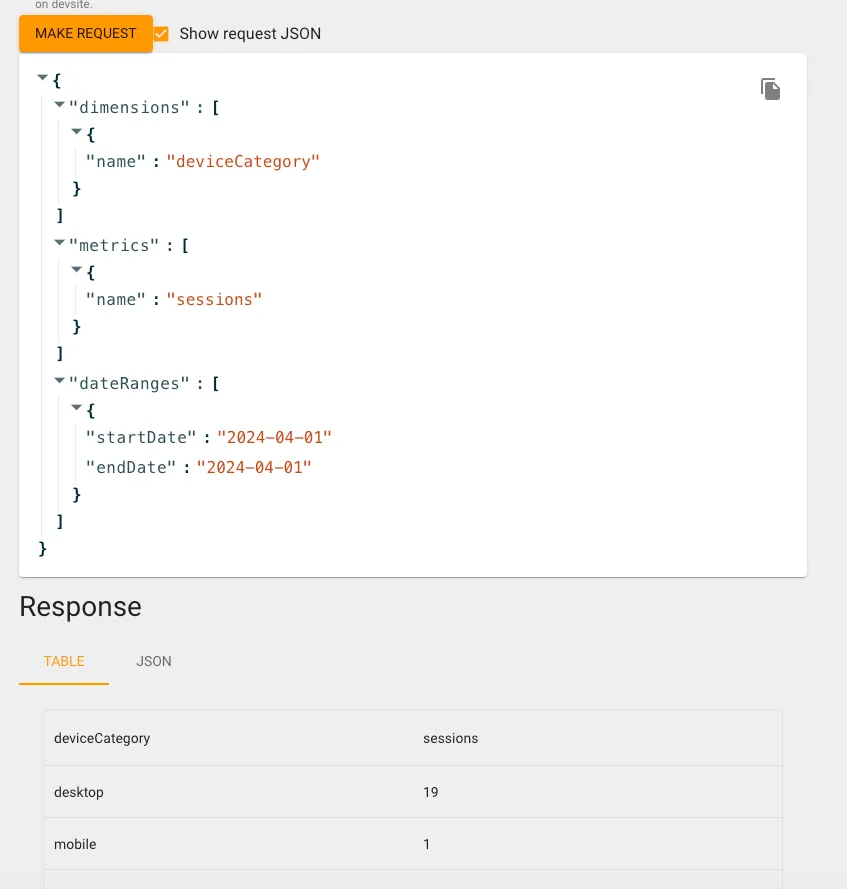
You can simultaneously compare the data under the same conditions in the GA4 backend. If the discrepancy is too large, it may be due to missing filter conditions, so please check again.
Summary
Here is a small pitfall discovered by a marketing colleague: some GA data may have delays, so the numbers you check today might differ from those checked yesterday (e.g., bounce rate). Therefore, it’s best to look back a few days to ensure the data reflects the final values.
After confirming the GA Debug Tool works fine, we can convert it into Google Apps Script.
Add a new file named GAData.gs:
// Remember to add Google Analytics Data API to Services, or you'll see this error: ReferenceError: AnalyticsData is not defined
// GA Debug Tool: https://ga-dev-tools.web.app/ga4/query-explorer/

class GAData {
  constructor(date) {
    this.date = date;

    const traffic = this.fetchGADailyUsage();
    this.pc_traffic = traffic["desktop"];
    this.mobile_traffic = traffic["mobile"];
  }

  fetchGADailyUsage() {
    const dimensionPlatform = AnalyticsData.newDimension();
    dimensionPlatform.name = "deviceCategory";

    const metric = AnalyticsData.newMetric();
    metric.name = "sessions";

    const dateRange = AnalyticsData.newDateRange();
    // Default query for data within the given date range e.g. 2024-01-01 ~ 2024-01-01
    dateRange.startDate = this.getDateString();
    dateRange.endDate = this.getDateString();

    // Filter Example:
    // const filterExpression = AnalyticsData.newFilterExpression();
    // const filter = AnalyticsData.newFilter();
    // filter.fieldName = "landingPagePlusQueryString";
    // const stringFilter = AnalyticsData.newStringFilter()
    // stringFilter.value = "/life\\|/article\\|/chat\\|/house\\|/event/230502\\|/event/230310";
    // stringFilter.matchType = "PARTIAL_REGEXP";
    // filter.stringFilter = stringFilter;
    // filterExpression.filter = filter;

    const request = AnalyticsData.newRunReportRequest();
    request.dimensions = [dimensionPlatform];
    request.metrics = [metric];
    request.dateRanges = dateRange;

    // Filter Example:
    // const filterExpression = AnalyticsData.newFilterExpression();
    // filterExpression.expression = filterExpression;
    // request.dimensionFilter = filterExpression;
    // or Not
    // const notFilterExpression = AnalyticsData.newFilterExpression();
    // notFilterExpression.notExpression = filterExpression;
    // request.dimensionFilter = notFilterExpression;

    const report = AnalyticsData.Properties.runReport(request, "properties/" + gaPropertyId).rows;
    // No data
    if (report == undefined) {
      return {"desktop": 0, "mobile": 0};
    }

    // [{metricValues=[{value=4517}], dimensionValues=[{value=mobile}]}, {metricValues=[{value=3189}], dimensionValues=[{value=desktop}]}, {metricValues=[{value=63}], dimensionValues=[{value=tablet}]}]

    var result = {};
    report.forEach(function(element) {
      result[element.dimensionValues[0].value] = element.metricValues[0].value;
    });

    return result;
  }

  getDateString() {
    return Utilities.formatDate(this.date, "GMT+8", "yyyy-MM-dd");
  }
}
Add test content to Main.gs:
const targetGoogleSheetID = "1-9lZCpsu3E7eDmO-lMkXJXQ6Y6KK4SiyU6uBODcDcFE";
// https://docs.google.com/spreadsheets/d/1-9lZCpsu3E7eDmO-lMkXJXQ6Y6KK4SiyU6uBODcDcFE/edit#gid=275710641

const gaPropertyId = "318495208";

function debug() {
  var report = new DailyReport(targetGoogleSheetID, new Date());
  report.execute();
  //
  var gaData = new GAData(new Date());
  Logger.log(gaData);
}
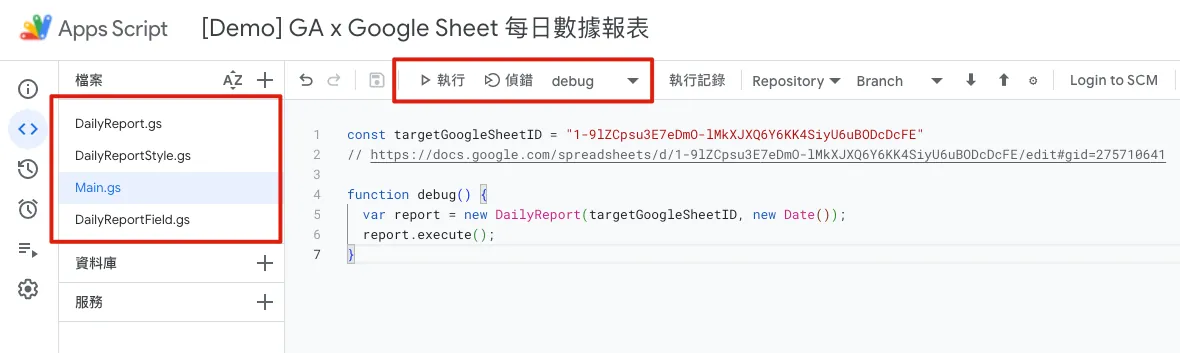
Click Run or Debug to get the script retrieval results:
OK! Match confirmed.
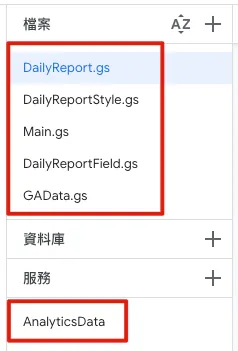
When this step is completed, the directory file structure will look like the image above.
4. Fill Data
After setting up the Sheet and retrieving the data, the next step is to fill the data into the columns.
Modify DailyReport.gs to add a new column by date and fill data logic:
class DailyReport {
  constructor(sheetID, date, gaData, inHouseReportData) {
    this.separateSheet = SpreadsheetApp.openById(sheetID);
    this.date = date;

    const dateString = Utilities.formatDate(date, "GMT+8", "yyyy/MM/dd");
    const weekString = ["Sunday", "Monday","Tuesday","Wednesday","Thursday","Friday","Saturday"][date.getDay()]; // Get the weekday, Sunday=0, Monday=1, etc.

    this.sheetFields = [
      new DailyReportField("Date", new HeaderDateStyle(), new HeaderDateStyle(), null, dateString),
      new DailyReportField("Weekday", new HeaderDateStyle(), new HeaderDateStyle(), null, weekString),
      new DailyReportField("Daily Traffic", new HeaderStyle(), new ContentStyle(), "#,##0", '=INDIRECT(SUBSTITUTE(ADDRESS(1,COLUMN(),4),"1","")&4)+INDIRECT(SUBSTITUTE(ADDRESS(1,COLUMN(),4),"1","")&5)'), // =4(PC Traffic) + 5(Mobile Traffic)
      new DailyReportField("PC Traffic", new HeaderStyle(), new ContentStyle(), "#,##0", gaData.pc_traffic),
      new DailyReportField("Mobile Traffic", new HeaderStyle(), new ContentStyle(), "#,##0", gaData.mobile_traffic),
      new DailyReportField("Registrations", new HeaderStyle(), new ContentStyle(), "#,##0", inHouseReportData.registers)
    ]
  }

  execute() {
    const sheet = this.getSheet();
    const dateColumnIndex = this.makeOrGetDateColumn(sheet); // Get existing or create new column for the date

    // Fill column contents
    for(const currentRow in this.sheetFields) {
      const sheetField = this.sheetFields[currentRow];
      const rowIndex = parseInt(currentRow) + 1;

      if (rowIndex != null) {
        const range = sheet.getRange(rowIndex, dateColumnIndex);
        const text = sheetField.value;
        const style = sheetField.contentStyle;
        this.setContent(range, text, style);
        this.setFormat(range, sheetField.format);
      }
    }
  }

  // Get target sheet for the given date
  getSheet() {
    // Use month to distinguish sheets, find the sheet for the current month
    var thisMonthSheet = this.separateSheet.getSheetByName(this.getSheetName());
    if (thisMonthSheet == null) {
      // If not found, create a new monthly sheet
      thisMonthSheet = this.makeMonthSheet();
    }

    return thisMonthSheet;
  }

  // Monthly sheet naming
  getSheetName() {
    return Utilities.formatDate(this.date, "GMT+8", "yyyy-MM");
  }

  // Create a new monthly sheet
  makeMonthSheet() {
    // Add new monthly sheet and move it to the first position
    var thisMonthSheet = this.separateSheet.insertSheet(this.getSheetName(), {index: 0});
    thisMonthSheet.activate();
    this.separateSheet.moveActiveSheet(1);

    // Insert first column, set header name, pinned, width 200
    thisMonthSheet.insertColumnsBefore(1, 1);
    thisMonthSheet.setFrozenColumns(1);
    thisMonthSheet.setColumnWidths(1, 1, 200);

    // Fill column names
    for(const currentRow in this.sheetFields) {
      const sheetField = this.sheetFields[currentRow];
      const text = sheetField.name;
      const style = sheetField.headerStyle;

      const range = thisMonthSheet.getRange(parseInt(currentRow) + 1, 1);
      this.setContent(range, text, style);
      range.setHorizontalAlignment("left");
    }

    // Set row heights
    thisMonthSheet.setRowHeights(1, Object.keys(this.sheetFields).length, 30);

    // Pin first and second rows (Date, Weekday)
    thisMonthSheet.setFrozenRows(2);

    // Add summary column
    thisMonthSheet.insertColumnsAfter(thisMonthSheet.getLastColumn(), 1); // Add one column after the last column
    const summaryColumnIndex = thisMonthSheet.getLastColumn() + 1;

    // Fill summary column
    for(const currentRow in this.sheetFields) {
      const sheetField = this.sheetFields[currentRow];
      const summaryRowIndex = parseInt(currentRow) + 1;

      const range = thisMonthSheet.getRange(summaryRowIndex, summaryColumnIndex);
      const style = sheetField.contentStyle;

      if (summaryRowIndex == 1) {
        // Date...
        this.setContent(range, "Total", style);
      } else if (summaryRowIndex == 2) {
        // Weekday...merge...
        const mergeRange = thisMonthSheet.getRange(1, summaryColumnIndex, summaryRowIndex, 1);
        this.setContent(mergeRange, "Total", style);
        mergeRange.merge();
      } else {
        this.setContent(range, '=IFERROR(SUM(INDIRECT(SUBSTITUTE(ADDRESS(1, 1, 4), "1", "") & '+summaryRowIndex+'):INDIRECT(SUBSTITUTE(ADDRESS(1, COLUMN() - 1, 4), "1", "") & '+summaryRowIndex+')), 0)', style);
      }
    }

    return thisMonthSheet;
  }

  // Create or get the column for the date
  // Add one column after the most recent date
  makeOrGetDateColumn(sheet) {
    const firstRowColumnsRange = sheet.getRange(1, 1, 1, sheet.getLastColumn()); // Get data range of first row (dates)
    const firstRowColumns = firstRowColumnsRange.getValues()[0]; // Get values of the range, 0 = first row

    var columnIndex = firstRowColumns.findIndex((date) => (date instanceof Date && Utilities.formatDate(date, "GMT+8", "yyyy/MM/dd") == Utilities.formatDate(this.date, "GMT+8", "yyyy/MM/dd"))); // Find index of matching date column

    if (columnIndex < 0) {
      // Not found, find position of previous day
      var preDate = new Date(this.date);
      preDate.setDate(preDate.getDate() - 1);

      while(preDate.getMonth() == this.date.getMonth()) {
        columnIndex = firstRowColumns.findIndex((date) => (date instanceof Date && Utilities.formatDate(date, "GMT+8", "yyyy/MM/dd") == Utilities.formatDate(preDate, "GMT+8", "yyyy/MM/dd")));
        if (columnIndex >= 0) {
          break;
        }

        preDate.setDate(preDate.getDate() - 1);
      }

      if (columnIndex >= 0) {
        columnIndex += 1;
        sheet.insertColumnsAfter(columnIndex, 1); // Insert a column after previous day column
        columnIndex += 1;
      }
    } else {
      columnIndex += 1;
    }

    if (columnIndex < 0) {
        sheet.insertColumnsAfter(1, 1); // Default, insert a column after the first column
        columnIndex = 2;
    }

    // Set column width
    sheet.setColumnWidths(columnIndex , 1, 100);

    return columnIndex
  }

  // Set column format style
  setFormat(range, format) {
    if (format != null) {
      range.setNumberFormat(format);
    }
  }

  // Fill content into the cell
  setContent(range, text, style) {
    if (String(text) != "") {
      range.setValue(text);
    }

    range.setBackgroundColor(style.backgroundColor);
    range.setFontColor(style.color);

    if (style.bold) {
      range.setFontWeight("bold");
    }

    range.setHorizontalAlignment(style.horizontalAlignment);
    range.setVerticalAlignment(style.verticalAlignment);
    range.setFontSize(style.size);
    range.setBorder(true, true, true, true, true, true, "black", SpreadsheetApp.BorderStyle.SOLID);
  }
}
Modify Main.gs to add data integration and assign values during the build phase:
const targetGoogleSheetID = "1-9lZCpsu3E7eDmO-lMkXJXQ6Y6KK4SiyU6uBODcDcFE";
// https://docs.google.com/spreadsheets/d/1-9lZCpsu3E7eDmO-lMkXJXQ6Y6KK4SiyU6uBODcDcFE/edit#gid=275710641

const gaPropertyId = "318495208";

function debug() {
  const date = new Date();
  const gaData = new GAData(date);
  const inHouseReportData = fetchInHouseReportData(date);

  const report = new DailyReport(targetGoogleSheetID, date, gaData, inHouseReportData);
  report.execute();

}

// Simulate some data that might be fetched from other platform APIs.
function fetchInHouseReportData(date) {
  // EXAMPLE REQUEST:
  // var options = {
  //   'method' : 'get',
  //   'headers': {
  //       'Authorization':  'Bearer XXX'
  //   }
  // };
  // OR
  // var options = {
  //   'method' : 'post',
  //   'headers': {
  //       'Authorization':  'Bearer XXX'
  //   },
  //   'payload' : data
  // };

  // var res = UrlFetchApp.fetch(url, options);
  // const result = JSON.parse(res.getContentText());

  // REMEMBER, DUE TO SECURITY REASON, We can't customize user-agent.

  return {"registers": Math.floor(Math.random() * (180 - 30 + 1)) + 30} // MOCK DATA random 30~180
}
After finishing, go back to Main.gs, select “debug,” and click to start debugging. Check if the execution results are correct and if there are any errors.
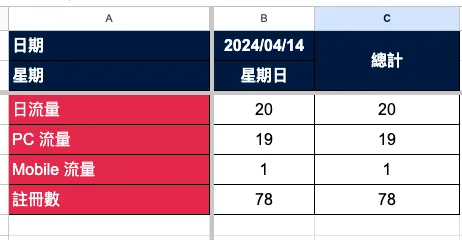
Back to Google Sheet! Success! We have successfully added the data for the specified date automatically.
5. Set up a schedule to run automatically every day
After the script is completed, just set the automatic trigger conditions, and it will run automatically every day.
Modify Main.gs to add the cronjob() function:
const targetGoogleSheetID = "1-9lZCpsu3E7eDmO-lMkXJXQ6Y6KK4SiyU6uBODcDcFE";
// https://docs.google.com/spreadsheets/d/1-9lZCpsu3E7eDmO-lMkXJXQ6Y6KK4SiyU6uBODcDcFE/edit#gid=275710641

const gaPropertyId = "318495208";

function debug() {
  cronjob();
}

// In reality, we usually check yesterday's data today to get complete information
function cronjob() {
  const yesterday = new Date();
  yesterday.setDate(yesterday.getDate() - 1);

  const gaData = new GAData(yesterday);
  const inHouseReportData = fetchInHouseReportData(yesterday);

  const report = new DailyReport(targetGoogleSheetID, yesterday, gaData, inHouseReportData);
  report.execute();
}

// Simulate some data that might be fetched from other platform APIs.
function fetchInHouseReportData(date) {
  // EXAMPLE REQUEST:
  // var options = {
  //   'method' : 'get',
  //   'headers': {
  //       'Authorization':  'Bearer XXX'
  //   }
  // };
  // OR
  // var options = {
  //   'method' : 'post',
  //   'headers': {
  //       'Authorization':  'Bearer XXX'
  //   },
  //   'payload' : data
  // };

  // var res = UrlFetchApp.fetch(url, options);
  // const result = JSON.parse(res.getContentText());

  // REMEMBER, DUE TO SECURITY REASONS, we can't customize user-agent.

  return {"registers": Math.floor(Math.random() * (180 - 30 + 1)) + 30} // MOCK DATA random 30~180
}
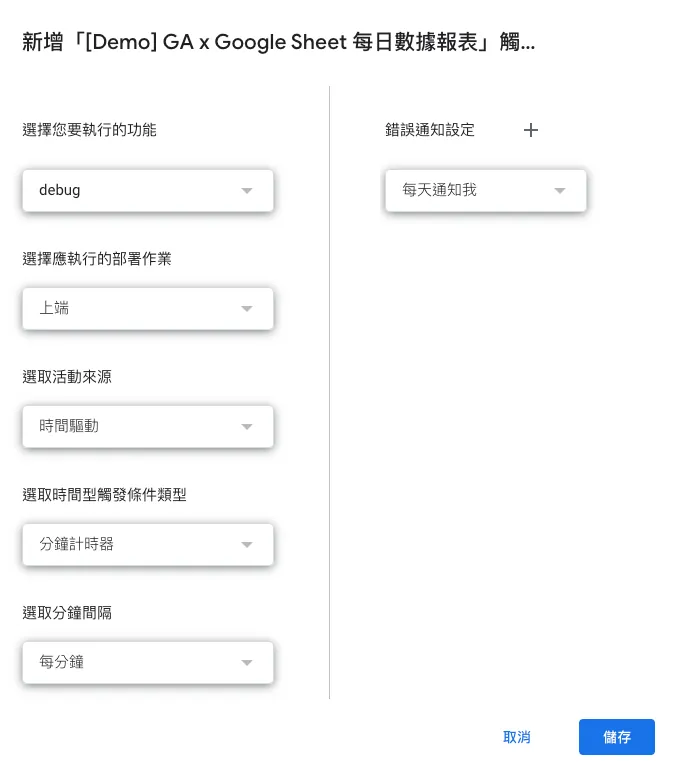
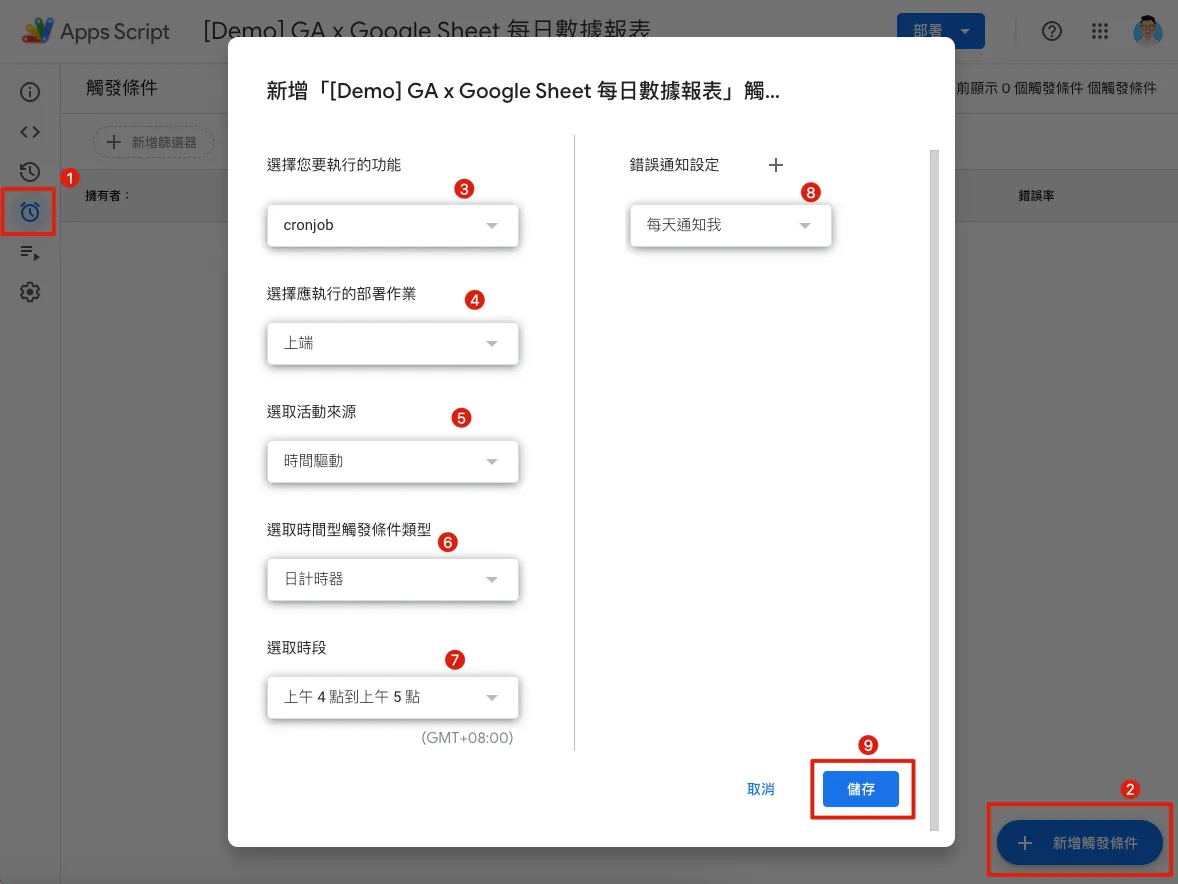
Switch to the “Triggers” tab in the editor, then click “Add Trigger” at the bottom right:
-
Select the function you want to run: the newly added
Main.gsFunctioncronjob -
Select the deployment to run: Head (meaning the latest version)
-
Select Event Source: Time-driven
-
Select time-driven trigger type: Day timer
-
Selected time period: AM 4:00 — AM 5:00 (GMT+08:00)
Usually runs right at AM 4:00. -
Error Notification Settings: Should notifications be sent immediately when the script encounters an error, or summarized once daily?
Save settings, done.
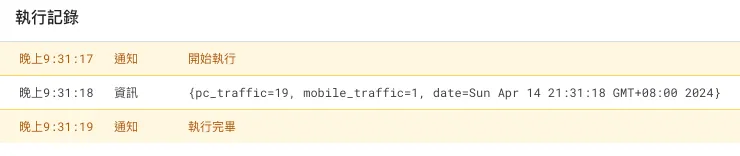
You can later check the execution logs in the “Executions” tab:
By now, we have completed the RPA functions for automated querying, adding data, and filling in the report. 🎉🎉🎉
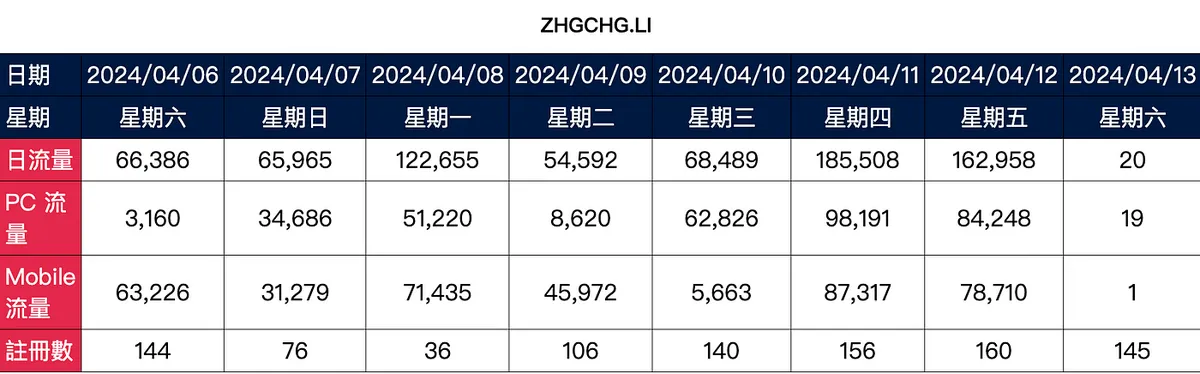
Building a Web GUI Dashboard
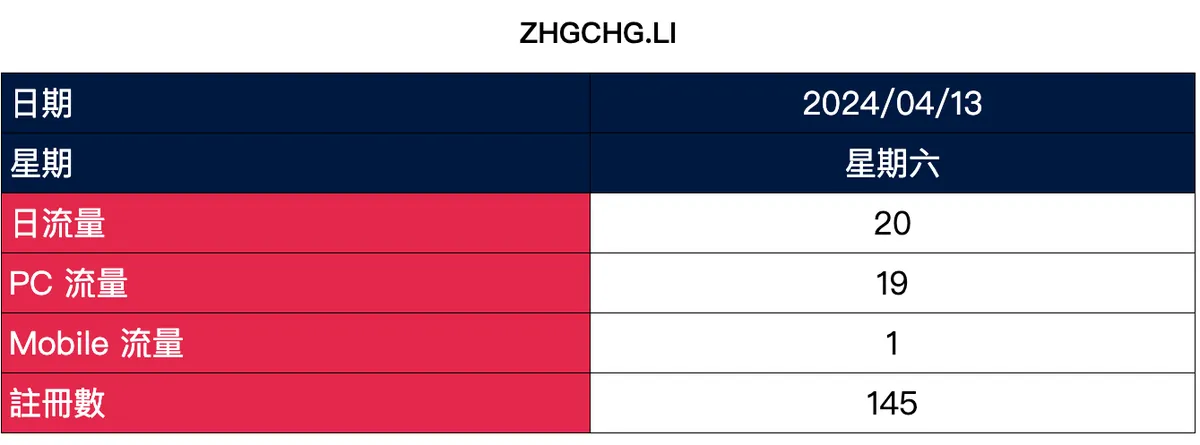
Next, there is a secondary requirement: we need to create a simple web page to display daily data (similar to a command center) that will be shown directly on a large screen on the team’s back wall.
The effect is shown in the image below:
Add Web_DailyReport.gs to read Google Sheet and convert columns and styles into HTML format for display:
class WebDailyReport {
  constructor(sheetID, dayCount) {
    this.separateSheet = SpreadsheetApp.openById(sheetID);
    this.dayCount = dayCount;
    this.sheetRows = [
      "Date",
      "Day of Week",
      "Daily Traffic",
      "PC Traffic",
      "Mobile Traffic",
      "Registrations"
    ];
  }

  allData(startDate) {
    var sheetRowsIndexs = {};
    var count = this.dayCount;
    var result = [];
    while (count >= 0) {
      const preDate = new Date(startDate);
      preDate.setDate(preDate.getDate() - (this.dayCount - count));
      const sheetName = Utilities.formatDate(preDate, "GMT+8", "yyyy-MM");
      const targetSheet = this.separateSheet.getSheetByName(sheetName);
      if (targetSheet != null) {
        const firstRowColumnsRange = targetSheet.getRange(1, 1, 1, targetSheet.getLastColumn()); // Get the first row (date) data range
        const firstRowColumns = firstRowColumnsRange.getValues()[0]; // Get the values of the range, 0 = first row
        var columnIndex = firstRowColumns.findIndex((date) => (date instanceof Date && Utilities.formatDate(date, "GMT+8", "yyyy/MM/dd") == Utilities.formatDate(preDate, "GMT+8", "yyyy/MM/dd"))); // Find the column index for the matching date

        if (columnIndex >= 0) {
          columnIndex = parseInt(columnIndex) + 1;
          if (sheetRowsIndexs[sheetName] == undefined \\|\\| sheetRowsIndexs[sheetName] == null) {
            sheetRowsIndexs[sheetName] = this.sheetRows.map((sheetRow) => this.getFieldRow(targetSheet, sheetRow));
          }

          if (result.length == 0) {
            // Add the first column
            const ranges = sheetRowsIndexs[sheetName].map((rowIndex) => (rowIndex != null) ? (targetSheet.getRange(rowIndex, 1)) : (null));
            result.push(this.makeValues(ranges));
          }

          const ranges = sheetRowsIndexs[sheetName].map((rowIndex) => (rowIndex != null) ? (targetSheet.getRange(rowIndex, columnIndex)) : (null));
          result.push(this.makeValues(ranges));
        }
      }

      count -= 1;
    }

    var transformResult = {};
    for (const columnIndex in result) {
      for (const rowIndex in result[columnIndex]) {
        if (transformResult[rowIndex] == undefined) {
          transformResult[rowIndex] = [];
        }

        if (columnIndex == 0) {
          transformResult[rowIndex].unshift(result[columnIndex][rowIndex]);
        } else {
          transformResult[rowIndex].splice(1, 0, result[columnIndex][rowIndex]);
        }

      }
    }

    return transformResult;
  }

  // Convert cell attributes to display object
  makeValues(ranges) {
    const data = ranges.map((range) => (range != null) ? (range.getDisplayValues()) : (null)).map((values) => (values != null) ? (values[0][0]) : (null));
    const backgroundColors = ranges.map((range) => (range != null) ? (range.getBackgrounds()) : (null)).map((values) => (values != null) ? (values[0][0]) : (null));
    const colors = ranges.map((range) => (range != null) ? (range.getFontColorObjects()) : (null)).map((values) => (values != null) ? (values[0][0]) : (null));
    const sizes = ranges.map((range) => (range != null) ? (range.getFontSizes()) : (null)).map((values) => (values != null) ? (values[0][0]) : (null));
    const bolds = ranges.map((range) => (range != null) ? (range.getFontWeights()) : (null)).map((values) => (values != null) ? (values[0][0]) : (null));
    const horizontalAlignments = ranges.map((range) => (range != null) ? (range.getHorizontalAlignments()) : (null)).map((values) => (values != null) ? (values[0][0]) : (null));
    const verticalAlignments = ranges.map((range) => (range != null) ? (range.getVerticalAlignments()) : (null)).map((values) => (values != null) ? (values[0][0]) : (null));

    var result = [];
    for(const index in data) {
        const row = data[index];
        result.push({
          "value": row,
          "backgroundColor": backgroundColors[index],
          "color": this.colorStripper(colors[index]?.asRgbColor()?.asHexString()),
          "size": sizes[index],
          "bold": bolds[index],
          "horizontalAlignment": this.alignConventer(horizontalAlignments[index]),
          "verticalAlignment": verticalAlignments[index]
        });
    }

    return result;
  }

  colorStripper(colorString) {
    if (colorString == undefined \\|\\| colorString == null) {
      return null
    }

    if (colorString.length == 9) {
      return "#"+colorString.substring(3, 9);
    } else {
      return colorString;
    }
  }

  alignConventer(horizontalAlignment) {
    if (horizontalAlignment == undefined \\|\\| horizontalAlignment == null) {
      return null
    }

    return horizontalAlignment.replace('general-', '')
  }

  getFieldRow(sheet, name) {
    const firstColumnRowsRange = sheet.getRange(1, 1, sheet.getLastRow(), 1); // Get the first column (field) data range
    const firstColumnRows = firstColumnRowsRange.getValues(); // Get the values of the range
    const foundIndex = firstColumnRows.findIndex((firstColumnRow) => firstColumnRow[0] == name);

    if (foundIndex < 0) {
      return null;
    } else {
      return foundIndex + 1;
    }
  }
}
Main.gs Add Web Request Handler:
const targetGoogleSheetID = "1-9lZCpsu3E7eDmO-lMkXJXQ6Y6KK4SiyU6uBODcDcFE";
// https://docs.google.com/spreadsheets/d/1-9lZCpsu3E7eDmO-lMkXJXQ6Y6KK4SiyU6uBODcDcFE/edit#gid=275710641

const gaPropertyId = "318495208";

function debug() {
  cronjob();
}

function cronjob() {
  const yesterday = new Date();
  yesterday.setDate(yesterday.getDate() - 1);

  const gaData = new GAData(yesterday);
  const inHouseReportData = fetchInHouseReportData(yesterday);

  const report = new DailyReport(targetGoogleSheetID, yesterday, gaData, inHouseReportData);
  report.execute();
}

function doGet(e) {
  return HtmlService.createTemplateFromFile('Web_DailyReport_ Scaffolding').evaluate();
}

function getDailyReportBody() {
  const html = HtmlService.createTemplateFromFile('Web_DailyReport_Body').evaluate().getContent();
  return html;
}

// FOR POST
// function doPost(e) {
//  ref: https://developers.google.com/apps-script/guides/web?hl=zh-tw
// }


// Simulate some data that might be fetched from other platform APIs.
function fetchInHouseReportData(date) {
  // EXAMPLE REQUEST:
  // var options = {
  //   'method' : 'get',
  //   'headers': {
  //       'Authorization':  'Bearer XXX'
  //   }
  // };
  // OR
  // var options = {
  //   'method' : 'post',
  //   'headers': {
  //       'Authorization':  'Bearer XXX'
  //   },
  //   'payload' : data
  // };

  // var res = UrlFetchApp.fetch(url, options);
  // const result = JSON.parse(res.getContentText());

  // REMEMBER, DUE TO SECURITY REASONS, we can't customize user-agent.

  return {"registers": Math.floor(Math.random() * (180 - 30 + 1)) + 30} // MOCK DATA random 30~180
}
Add Web_DailyReport_ Scaffolding.html Web Dashboard framework. Since our war room screen needs to automatically update content, we create a web scaffold that periodically fetches HTML content using Ajax:
<!DOCTYPE html>
<html>
  <head>
    <base target="_top">
    <script>
      function onSuccess(html) {
        if (html != null) {
          var div = document.getElementById('result');
          div.innerHTML = html;
        }
     }
     setInterval(()=>{
       google.script.run.withSuccessHandler(onSuccess).getDailyReportBody()
     }, 1000 * 60 * 60 * 1);
     google.script.run.withSuccessHandler(onSuccess).getDailyReportBody();
    </script>
  </head>
  <body>
    <div id="result">Loading...</div>
  </body>
</html>
Add Web_DailyReport_Body.html where data is actually rendered into HTML:
<!DOCTYPE html>
<html>
  <head>
    <base target="_top">
    <style>
    table {
        border-collapse: collapse;
        width: 100%;
        text-align: center;
    }
    th, td {
        border: 1px solid #000000;
        padding: 8px;
        text-align: center;
        font-size: 36px;
    }
      </style>
  </head>
  <body>
      <h1 style="text-align:center">ZHGCHG.LI</h1>
      <table id="dataTable">
        <tbody>
          <?
          // Display data for the last 7 days
          const dashboard = new WebDailyReport(targetGoogleSheetID, 7);
          // Starting from yesterday
          const yesterday = new Date();
          yesterday.setDate(yesterday.getDate() - 1);
          const data = dashboard.allData(yesterday);
          for(const rowIndex in data) {
            const row = data[rowIndex];
            ?>
            <tr>
              <?
              for(const columnIndex in row) {
                const column = row[columnIndex];
                ?>
                <td style="background-color: <?=column["backgroundColor"]?>; color: <?=column["color"]?>; text-align: <?=column["horizontalAlignment"]?>;">
                  <?=column["value"]?>
                </td>
                <?
              }
              ?>
            </tr>
            <?
          }
          ?>
        </tbody>
      </table>
      <script>
  </body>
</html>
Please note, we fetch data from the past 7 days starting from yesterday, excluding today’s data.
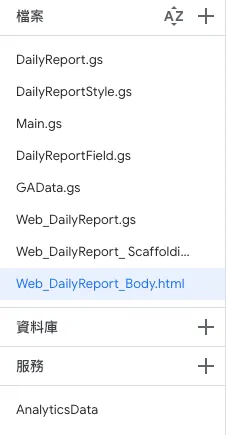
The project file directory after completing the above steps is as follows:
Test Deployment:
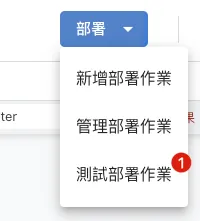
Click the project’s top right corner “Deploy” -> “Test deployments”
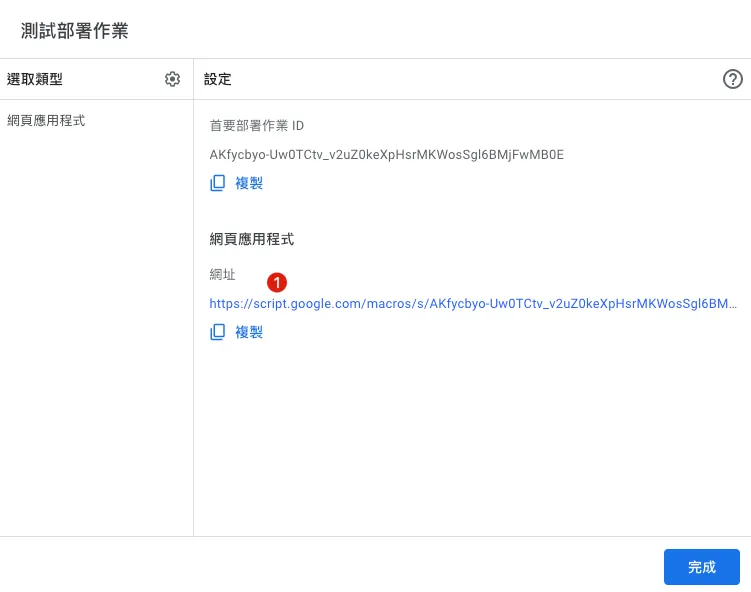
-
After deployment, click the URL to view the test results.
-
Please note this URL is for one-time testing only. If the code is modified, you need to redeploy and test again.
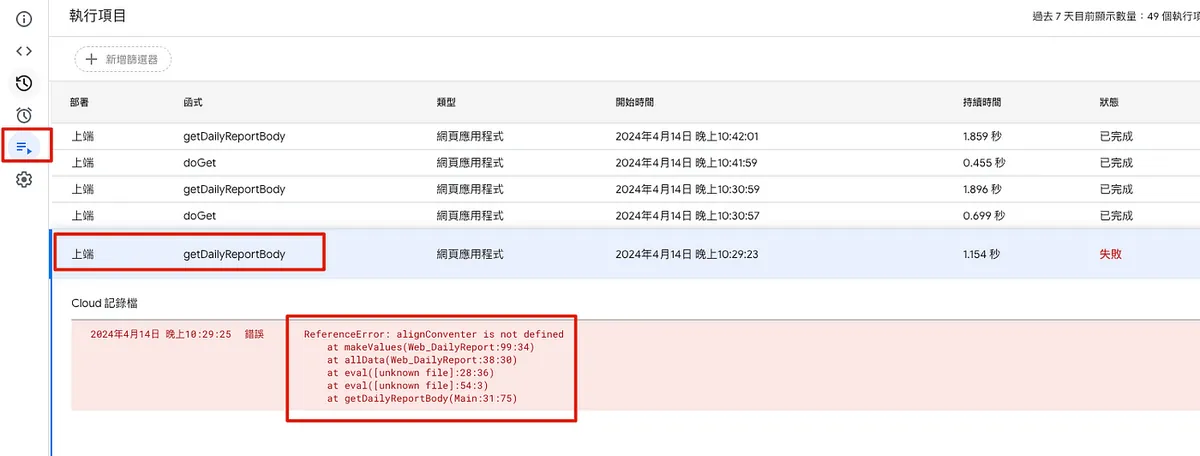
If stuck on Loading… with no content or a server error appears, go back to the editor’s “Executions” tab to check the error messages:
Complete Official Deployment:
If the test runs smoothly, you can proceed with the official deployment and release the URL.
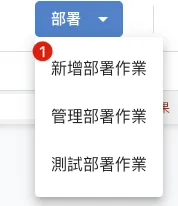
Click the project’s top-right corner “Deploy” -> “New deployment” -> top-left “Select type” -> “Web app”:
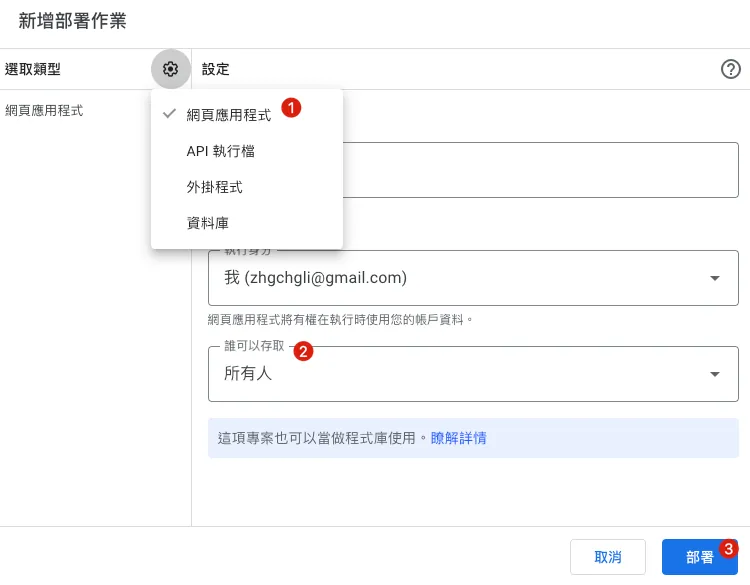
-
Execution identity: Default is the current account (same as the Google Apps Script user)
-
Who can access: Set to “Anyone with the link” so anyone who knows the URL can access, or set to “Organization only” which requires Google sign-in to access.
-
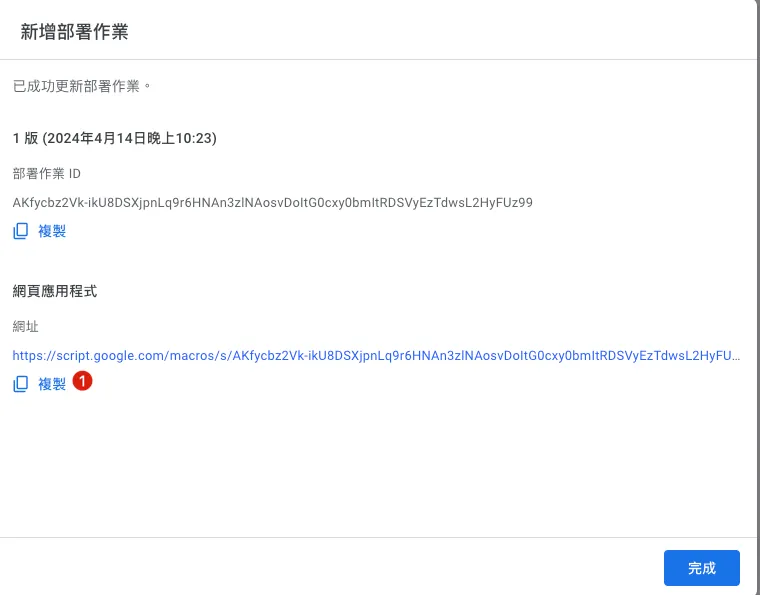
Deployment completed, URL obtained.
Code changes require redeployment to take effect:
Please note that when the code changes, you need to redeploy (the URL will not change) for the updates to take effect; otherwise, it will remain the old version.
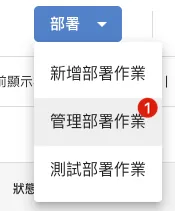
Click the project’s top-right corner “Deploy” -> “Manage deployments”:
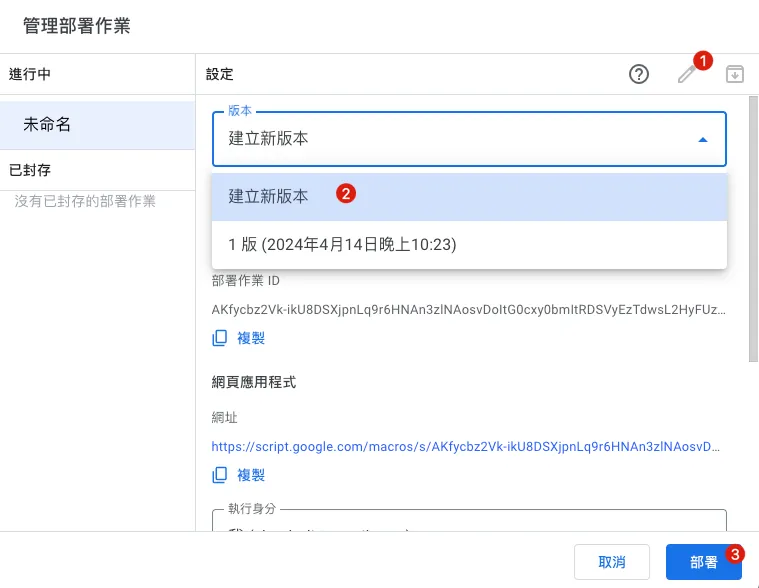
Click the top right “Pen 🖊️ ICON” -> “Versions” -> “Create New Version” -> “Deploy”.
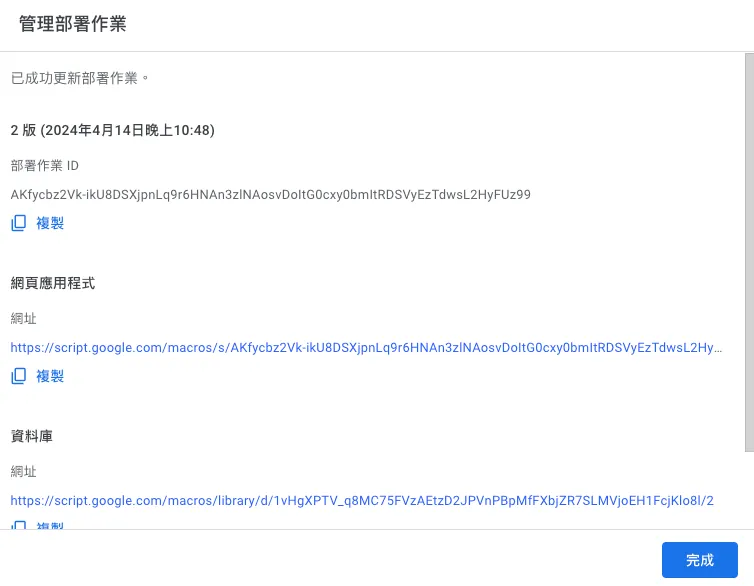
After deployment, click the URL or refresh the original URL to see the updated changes.
🎉🎉Done! All our RPA requirements have been completed.🎉🎉
Final result:
(Update the code to backfill data for the current month; otherwise, only yesterday’s data will be available for new data)
Complete Google Sheet Demo:
-
Google Sheet:
https://docs.google.com/spreadsheets/d/1-9lZCpsu3E7eDmO-lMkXJXQ6Y6KK4SiyU6uBODcDcFE/edit?usp=sharing -
Web GUI URL:
https://script.google.com/macros/s/AKfycbz2Vk-ikU8DSXjpnLq9r6HNAn3zlNAosvDoItG0cxy0bmItRDSVyEzTdwsL2HyFUz99/exec -
Google Apps Script: https://script.google.com/home/projects/1vHgXPTV_q8MC75FVzAEtzD2JPVnPBpMfFXbjZR7SLMVjoEH1FcjKlo8l/edit
Other Daily Life Applications:
Robotic Process Automation with Google Apps Script — Github Repo Star Notifier to Line
Robotic Process Automation with Google Apps Script — Notion Database to Calendar
■■■■■■■■■■■■■■
ZhgChgLi @ Twitter Says:
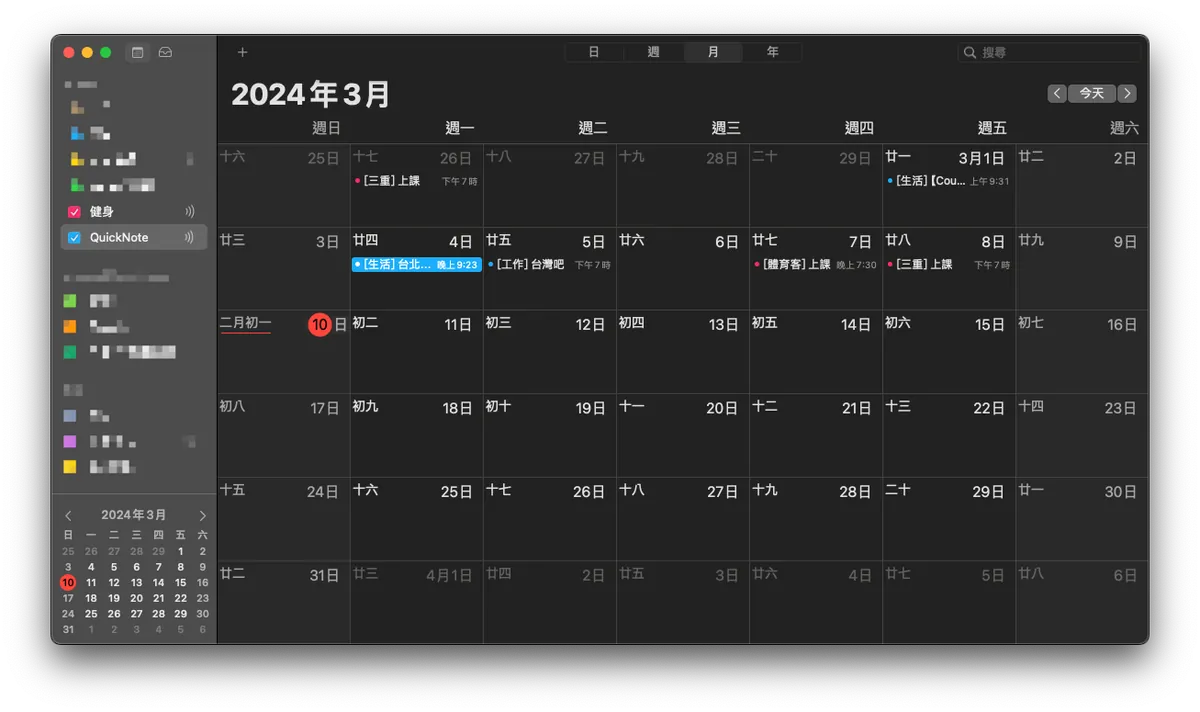
Notion Calendar is really hard to use and cannot replace Apple Calendar,
resulting in having to check both Notion Calendar and Apple Calendar.
Notion does not officially provide an export function for .ics calendars, so I had to create my own .ics exporter using Google Apps Script Web App + Notion API, then import them all into Apple Calendar.
The implementation effect is shown in the image. The POC source code is as follows:
gist.github.com/zhgchgli0718/4… https://t.co/Lfd4AHLcHE
Tweeted at 2024-03-10 07:01:33.
■■■■■■■■■■■■■■
Previously implemented a simple Notion to Calendar feature.
The implementation connects to the Notion API to fetch database data and generate an ICS format webpage, then deploys it as a public webpage; simply add this URL to Apple Calendar.
Main.gs :
// Constant variables
const notionToken = "XXXXX";
const safeToken = "XXXXX";

function doGet(e) {
  const ics = HtmlService.createTemplateFromFile('ics');

  if (e.parameter.token != safeToken) {
    return ContentService.createTextOutput("Access Denied!");
  }

  ics.events = getQuickNote();

  return ContentService.createTextOutput(ics.evaluate().getContent()).setMimeType(ContentService.MimeType.ICAL);
}

function debug() {
  const ics = HtmlService.createTemplateFromFile('ics');
  ics.events = getQuickNote();
  Logger.log(ics.evaluate().getContent());
}

function getQuickNote() {
  // YOUR FILTER Condition:
  const payload = {
    "filter": {
      "and": [
        {
          "property": "Date",
            "date": {
            "is_not_empty": true
          }
        }
        ,
        {
          "property": "Name",
            "title": {
            "is_not_empty": true
          }
        }
      ]
    }
  };
  const result = getDatabase(YOUR_DATABASE_ID, payload);
  var events = [];
  for (const index in result.results) {
    const item = result.results[index]
    const properties = item.properties;

    const id = item['id'];
    const create = toICSDate(item["created_time"]);
    const edit = toICSDate(item["last_edited_time"]);
    const startDate = properties['Date']['date']['start'];
    const start = toICSDate(startDate);
    var endDate = properties['Date']?.['date']?.['end'];
    if (endDate == null) {
      endDate = startDate;
    }
    const end = toICSDate(endDate);
    const type = properties['Type']?.['multi_select']?.[0]?.['name'];

    const title = "["+type+"] "+properties?.['Name']?.['title']?.[0]?.['plain_text'];
    const description = item['url'];

    events.push(
      {
        "id":id,
        "create":create,
        "edit":edit,
        "start":start,
        "end":end,
        "title":title,
        "description":description
      }
    )
  }
  return events;
}
// Convert to UTC Date
function toICSDate(date) {
  const icsDate = new Date(date);
  icsDate.setHours(icsDate.getHours() - 8);
  return Utilities.formatDate(icsDate, "GMT+8", "yyyyMMdd'T'HHmmss'Z'");// 20240304T132300Z
}

// Notion
function getDatabase(id, payload) {
  const url = 'https://api.notion.com/v1/databases/'+id+'/query/';
  const options = {
    method: 'post',
    headers: {
      'Authorization': 'Bearer '+notionToken,
      'Content-Type': 'application/json',
      'Notion-Version': '2022-06-28'
    },
    payload: JSON.stringify(payload)
  };
  const result = UrlFetchApp.fetch(url, options);
  return JSON.parse(result.getContentText());
}
ics.html :
BEGIN:VCALENDAR
PRODID:-//Google Inc//Google Calendar 70.9054//EN
VERSION:2.0
CALSCALE:GREGORIAN
METHOD:PUBLISH
X-WR-CALNAME:NotionCalendar
X-WR-TIMEZONE:Asia/Taipei
BEGIN:VTIMEZONE
TZID:Asia/Taipei
X-LIC-LOCATION:Asia/Taipei
BEGIN:STANDARD
TZOFFSETFROM:+0800
TZOFFSETTO:+0800
TZNAME:CST
DTSTART:19700101T000000
END:STANDARD
END:VTIMEZONE
<?
  for(const eventIndex in events) {
    const event = events[eventIndex];
    ?>
BEGIN:VEVENT
DTSTART:<?=event["start"]?>

DTEND:<?=event["end"]?>

DTSTAMP:<?=event["edit"]?>

UID:<?=event["id"]?>

CREATED:<?=event["create"]?>

LAST-MODIFIED:<?=event["edit"]?>

SEQUENCE:0
STATUS:CONFIRMED
SUMMARY:<?=event["title"]?>

DESCRIPTION:<?=event["description"]?>

TRANSP:OPAQUE
END:VEVENT
<?
  }
?>
END:VCALENDAR
As before, deploy as a web service by clicking the project’s top right corner “Deploy” -> “New deployment” -> top left “Select type” -> “Web app”:
- Set access to “Anyone” because Google login verification cannot be performed when adding the Calendar.

Add the URL to your calendar subscription, done 🎉🎉🎉🎉 !
Business Time
If you and your team need automation tools or process integration—whether it’s Slack App development, Notion, Asana, Google Sheet, Google Form, GA data, or other integrations—feel free to contact me for development.


Comments